• Login

Part 3: How to do it, Case Studies and White Papers and other References

Discussion of how to do it, real world complexity, challenges and opportunities, preparatory steps, design and development, coding conventions and standards, a series of case studies in which dramatic benefits accrued through use of Precision Configuration and other references


<<< PREVIOUS SUB-SUB-SECTION:  Part 2: Why Use JAR&A, Required Knowledge and Experience, Cubic Business Model and Chart of Accounts and Taxonomy Software

NEXT SECTION:  Custom Strategic Software Design and Oversight of Construction >>>

NEXT SUB-SECTION:  Example General Ledger Manual >>>


Section 7 -- How to do it

Section 7.1

The challenge


The challenge for most organizations can be summarized as follows:

1.  It is abstract

2.  Takes longer than you would expect

3.  Costs more than you would expect

4.  Requires a senior and very experienced facilitator

5.  Requires significant executive and senior management time

6.  If you get it wrong your organization will suffer and pay the price on an on-going basis for as long as the bad design remains in place

7.  Requires maintenance by a relatively senior, well trained, well-disciplined person

8.  Once it is right it is obviously right – getting there is the challenge

9.  Motivating the investment is therefore frequently a challenge


Section 7.2

The opportunity


The opportunity for most organizations can be summarized as follows:

1. Make a huge positive difference to the quality and quantity of management information 

2. Very considerable strategic gain through better decisions informed by better information 

3.  Greatly improved ease of use of all affected systems 

4.  Significant operational efficiencies – same staff able to do more and / or head count reduction through natural attrition

5. Grow faster and more reliably – quickly and easily conduct due diligence against own benchmarks, quickly integrate acquisitions into existing reporting schemes

6.  Other operational efficiencies such as reduction in Audit time and cost. 

7. This is the single most value adding investment most organizations can make relating to their business information systems (ERP, DW, BI, etc) IF it is correctly executed – JAR&A will guide you in doing this


Section 7.3

The essence of the solution


What is the essence of the JAR&A SEPT solution?

1. Strategic Engineered Precision Taxonomies (SEPT) and Precision Configuration 

2. Strategic -- extremely logical content from a strategic, essence of the business, practical, common sense perspective

3.  Engineered – rigorous, robust, reliable, sustainable, well designed

4. Precision – accurately models the business, easy to understand and apply, precise language, etc

5.  Taxonomies – hierarchical semantic structures that accurately model the real world complexity of the business

6. Precision configuration – uses the logic of the taxonomies to develop robust rules for configuration and enables auto population of many configuration fields

7.  Configure the system – be it ERP, Data Warehouse, or other repository of business data so that the system APPEARS to have intelligent understanding of the organization (through the content) and is therefore extremely intuitive and easy to use by staff with knowledge of the business from junior clerks to the CEO and shareholders


Section 7.4

Complexity


In considering complexity keep in mind the following:

1.  Real business is extremely complex

2.  What, why, when, how, etc

3.  Simple to use systems accurately model REAL complexity

4.  Internally "simple" systems that do NOT accurately reflect real complexity are DIFFICULT to use

5.  Internally "complex" systems that reflect reality are EASY to use

6.  Optimise system complexity versus ease of use - be real

7.  KISS ("keep it simple stupid" thinking can lead to serious errors


Section 7.5

Preparatory steps for a SEPT project


The following steps should be following in commencing a SEPT project:

1.  Executive interviews

1 on 1 one hour executive strategic interviews with each of the executive team and senior managers.

Questions include:

  •   "what is the essence of the business and how does it thrive?"(strategy) 
  •   "critical concerns with regard to present systems"
  •   "critical success factors for a new solution" (not necessarily a new system)


Take detailed notes and listen attentively.  Active listen by asking questions directed at gaining understanding and further insight.


2.  Walkthrough the business

Including site visit/s, factory visit, warehouse visit, etc.  Get a feel for the business of the business.  Guided by CEO, executive or senior manager – see the business through their eyes.  Followed by interviews with managers and staff coupled to walkthrough of the systems.


3.  Walkthrough current systems

Evaluate the systems in the context of all the information gathered to that point.  Hold up against the factors causing failure and critical factors for success.  Look particularly at the configuration, Chart of Accounts, Materials / Item / Product Master, etc – do they come close to SEPT standards, where are they on the scale of 0 to 10 – refer article on this topic.


4.  Walkthrough of new system

If a new system is to be installed, either an upgrade or re-implementation or a completely new system have a walkthrough of this system – main points of interest on a module by module basis.


5.  Formal report summarizing findings

Write a critical factor based report with bullet points on seven plus or minus two critical findings and key recommendations.  Be willing to challenge invalid thinking and to identify if the present system can be remediated.  A SEPT Data Warehouse implementation is frequently the most appropriate solution.


6.  Presentation to EXCO of findings and recommendations

Present the findings to the Executive Committee.


7.  Plan


8.  Project approval


9.  Engage with executives and develop high level taxonomies

Engage with the executive to develop the high level taxonomy frameworks and then with the rest of the business to flesh-out the taxonomies.  Train facilitators as appropriate.


Section 7.6

Strategic Engineered Precision Taxonomies and Configuration

Getting from where you are to where you want to be


So, having read this far you are beginning to think that a SEPT configuration is for you.

How do you get there?

Following are some important milestones you should plan for:

1.  Recognize and cost the problem

Before you can go ahead with a SEPT project you need to recognize that your current situation IS in fact a consequence of imprecise and weak configuration.

It is vital that you attach a currency value to the scale of the problem you are experiencing.

Estimate the efficiency and effectiveness losses and direct costs that you are incurring at both an operational and a strategic level, the lost opportunity costs, etc.  Chances are these are huge.

It is vital that you do this first otherwise the time and currency cost of the SEPT project will put you off.

If you are brutally frank about what your current sub-optimal situation is costing you you will find the SEPT project HIGHLY COST EFFECTIVE but if you skirt the issues you will jib at paying what it takes to do the job properly.


2.  Appoint an executive level expert on SEPT

Before you go any further you need to find an executive level expert in the field of Strategic Engineered Precision Taxonomies and Configuration – someone who can talk authoritatively at the executive level and who can facilitate authoritatively at that level.

You do not need a lot of this persons time but you do need quality time.

Any corner cutting at this point is highly inadvisable, if you lack strategic insight in the high level design of your taxonomies you will lack that insight throughout the entire solution.

James Robertson is available to assist with this component.

This person may be supported by other staff or you may decide to have him or her train up your staff to do the "leg-work".


3.  Appoint an executive level implementation advisor

This may be the same person as the SEPT expert but it also needs to be someone with lots of experience, someone with "grey hair" who can advise fearlessly at the executive level and understands the need for discipline and who can ensure that the project is run effectively.

James Robertson is available to assist with this component.


4.  Information audit

Undertake a comprehensive information audit of all your systems to establish all the drop down lists, validation lists, master lists, class lists, etc that occur throughout your organization.

Organize this on a logical entity basis and document exactly what the vendors of the software say the field is supposed to do, what software functionality is linked to the list and what content is in the list at present.  The present content is useful as a "brainstorm" list but does not necessarily contain the correct information.

Based on this audit map out the priorities in terms of developing taxonomies on a 20:80 basis – what is the 20% of the SEPT effort that will deliver 80% of the SEPT benefits?


5.  Plan the project

Plan the project taking account of the JAR&A Critical Factors for IT Implementation Success and running the project so as to prevent the Critical Factors Causing IT Implementation Failure from kicking in.

It is vital to plan for taxonomies and configuration to lead and process to follow.


6.  Purchase taxonomy development, deployment and maintenance software

Precision taxonomies can be developed to a point in spreadsheets if you have someone who really understands the principles and conventions well but in terms of generating and managing precision taxonomies software is vital.

James Robertson and Associates are in the process of developing a suite of taxonomy software which will soon be available for purchase to assist in the entire spectrum of these facilities.  Our goal is to give you access to knowledge based software that taps into as much of the knowledge and experience in the head of James Robertson and possible.


7.  Develop the high level structure of your new taxonomies

Assisted by the executive level expert mentioned above, develop the high level structure of  your taxonomies.  This must take place through engagement with your executive team.

Refer to the section on "The power of an executive with a blank sheet of paper" — it is VITAL that you start with a clean sheet and do not attempt to panel beat an existing list – you can always map your old list to  your new list subsequently but there is absolutely no point in trying to beat your beaten up information jalopy into a new shape J


8.  Develop detailed taxonomies and configuration

Once the high level structure of the taxonomies has been developed more junior personnel, either from your own organization or the service provider can facilitate the development of the full detail of the taxonomies assisted by the SEPT expert referred to above.


9.  Deploy in a new instance of your Data Warehouse and in time your ERP

Once the taxonomies have been developed deploy them FIRST in the ETL (Extract, Transform, Load) layer of your Data Warehouse in a NEW instance of your Data Warehouse technology with a NEW implementation of your BI tool, or buy a DW and BI tool and start from scratch.

The mapping and transform exercise onto your ERP will be tedious, frustrating and slower than you would like and the debugging will be painful, however, once it is done, provided you are disciplined about maintaining the mappings you will have done the 20% of the work that will unlock 80% of the value of precision taxonomies in your business.

In this process you will have to add some detail to the lists in your ERP and may have to repopulate some lists immediately.

This is where you will unlock much of the value – develop a full suite of simple and advanced management reports, models, analytical tools, etc and start to get insight into the operation of your business.

Later you MAY decide to start trickling the new taxonomies down into your ERP in a very controlled manner recognizing that every change you make WILL break things in the ERP configuration.  Provided this is done carefully and systematically these risks can be contained and eventually you will achieve the 20% of the re-implementation of your ERP that will unlock 80% of the benefits of SEPT in the ERP.

In my experience, unless your ERP is terribly badly implemented this approach will give you a more than adequate outcome -- the cost of a full-blown laboratory based implementation is just too great for nearly all organizations.

SEPT offers huge benefits which will far outweigh the time and cost of executing the SEPT project provided you are brutally frank about what your current configuration is really costing you!


Section 7.7

Design and development stages


The following are the stages in design and deployment of SEPT taxonomies and Precision Configuration:

1.  Fundamental strategic understanding of business drivers

a.  Primary focus for measurement 


2.  Fundamental definition of business, product, etc entities and relationships

a.  Define primary components to be measured

b.  Business model, market model, etc


3.  List all possible information

a.  Research and brainstorm

b.  Past and present information

c.  Likely future information


4.  Structure the data

a.  Hierarchical first principles classification of all possible information

b. based on strategic analysis and entity analysis

c.  Everyone understands

d. Fundamentally intuitively sound

e. MultiStage© picklists in software if possible


5.  Semantic analysis

a.  Fit the text to the display field

b.  Words are all the operator has to decide what to post to

c.  Standard suffixes

d.  Standardise abbreviations

e.  Hierarchy builds a sentence

f.   No ambiguity, no non-conformities


6.  Code the structured data


7.  Apply business rules

a.  Limit display of lists to the components that apply to a particular operator or location

b.  Corresponding rules in software

c.  Classification of fields on lists


Section 7.8

Categories of lists


There are a variety of types of list which have distinct attributes in terms of the design of the taxonomies that go with the lists:

1.  Random name based lists

The simplest type of list is a randomly generated alphabetically sorted list of customers, suppliers or other comparable data.

Items are added to the list as business proceeds and there is no logic or control over what gets added to the list.

For such lists it is not possible to develop a taxonomy although it is possible to adopt coding conventions such as first three characters of the supplier name followed by a three digit sequence number for repeat occurrences of that name.

The same approach applies to personnel codes for software access control, etc.

Examples would include STA001 for Standard Bank or RobertJA001 for James A Robertson.

The value of having a standard code format is that references, etc are more consistent and the list appearance is neater and it is easier to manipulate the list electronically.

The number of characters and number of digits would be determined from consideration of the size of the organization and foreseeable growth over say the next ten years.  Ease of remembering the code and ease of interpreting the code is also a consideration.

The classification of suppliers, customers, etc will fall under the simple or intermediate validation list category of lists.


2.  Project and other time sequential lists

Project lists have the distinct characteristic that the list grows in time with no other logic.

In some cases one might use some intelligence in a prefix such as RJ00175 where the RJ represents projects run by project leader Robertson James (RJ) and 00175 is a sequence number which indicates that this is the 175th project under the control of that project leader.

The number of digits is determined from consideration of the maximum number of projects that can reasonably be foreseen for one project leader in the next ten years or similar.

This code provides a short-hand referencing method that allows transactions such as time sheet entries, purchase orders, etc to be directly linked to the project.

In cases like this I recommend the use of a check digit such that the above example would take the form RJ00175c where "c" represents a check digit that might be the rightmost digit of the sum 1x5 + 2x7 + 3x1 + 4x0 + 4x0 where each digit of the code is multiplied by some factor and the composite code gives rise to a check digit which is a direct function of the numeric elements of the code.  In the above example the sum would be 5 + 14 + 3 + 0 + 0 = 22 so the check digit would be 2 (rightmost digit of 22) and the full project number would be RJ001752.

There are more sophisticated algorithms for check digit calculation and check digits can be computed on the alpha component as well if required.

The goal of the check digit is to ensure that if a typing error is made and two digits are transposed during data capture the resulting erroneous number is unlikely to be a valid code.  This is important in any situation where high speed, high volume data capture is required and greatly improves data accuracy.

Complex check digit algorithms are used in Credit Card and other bank account number generation.

Note that bank account number generation is a specialized field which is outside the scope of this handbook.

Check digits could also be used with Customer codes and Supplier codes as discussed in the previous section.

Check digits can also be used for sequential detail in Material Master type data at the finer levels of the code where time-sequential data may be recorded.

The classification of projects will be a simple or intermediate validation list.


3.  Simple validation lists

Simple validation lists are lists in any location in software where simple classifications occur.  Perhaps the simplest example would be Gender – e.g. Male, Female, Unknown for "Gender of purchaser".

This would extend to things like Credit Note Reason Codes, basic classifications of products, etc.

There are innumerable examples of simple validation lists in well-designed software.

These lists may drive software intelligence.

I would classify a simple list as having one or two levels of hierarchy and, by extension, not more than about 50 entries.

In most cases with strategic executive input the content of such lists is finite and can be circumscribed at a level that the list can be built in such a way that it will not change much over time.


4.  Intermediate complexity validation lists

Intermediate complexity validation lists are simply more complex lists than the simple lists discussed above.

Examples would include Locations and Functions in the Cubic Business Model and would have between three and five levels of hierarchy.

Intermediate lists can be encountered anywhere in software where reasonably complex data is classified.

As with the intermediate lists the scope can be reasonably clearly defined with strategic executive input taking a medium to long term view of where the business is going.


5.  Charts of Accounts

The Chart of Accounts is typically a very specific form of complex list which will tend to have between five and ten levels of hierarchy and between 1,000 and 10,000 entries.

A Chart of Accounts is a distinct taxonomy because its design is based on accounting principles and conventions and for any business its scope is distinct and finite – it is therefore generally possible to build a Chart of Accounts that will last for many years with minor changes PROVIDED the General Ledger is used effectively and the business does not attempt to include excessive evolving detail in the Chart of Accounts.

Notwithstanding the above comment, a well-designed Chart of Accounts taxonomy will accommodate considerable change and growth over many years.

A Chart of Accounts taxonomy will typically be numeric only with occasional exceptions where business considerations indicate that Alpha is required to accommodate specific logic or more than 10 items occur at any level in the hierarchy (generally NOT recommended).


6.  Product / Material / Item Master lists / classifications

In most organizations the content of the Product Master, Material Master, Item Master or equivalent list is diverse and complex and complex hierarchies and code schemes result.

These are the most complex lists.

In some cases the Product or Material list will be an open ended random list coded on the basis of EAN Barcode or other random sequence number allocated by suppliers, in this case the logic must be contained in the Product Classification, Material Group or other comparable list.

Product / Material and Item Master lists can include elements of all the other categories of logic and coding listed above.


7.  Cubic Business Model

The cubic business model is a multi-dimensional assembly of taxonomies (lists) to model the business and results in a three or more segment compound code scheme comprising business divisions (business units), physical locations, functions and specific accounts picked from the Master Chart of Accounts.

The first three dimensions of this code scheme also apply to the categorization of personnel, assets and other physical elements of the business.


8.  Project plan work breakdown structures

Project plans have a very specific logic insofar as they map out the logical progression of a project from start to finish.

Most project plans are NOT designed from the perspective of the management of the project towards an outcome but are designed from consideration of estimating the project in the first place.  This is NOT the right approach.

A plan that can be used for management requires a consistently fine level of granularity at the work execution level with work packages that might be classified as "parts, tasks and activities" in reusable modules that take account of the human aspects of project execution.  The lowest level activities should have an execution time-span of between one and three weeks so that for monthly progress reporting an activity is either not started, in process or completed and is not in process for more than one month.

This is the only way to really evaluate the progress of a project from a management perspective.

This is over-and-above the application of the principles of precision taxonomies advocated in this handbook.


9.  Filing and document classification

Filing and document classification as a standard across an entire enterprise is vital to the longevity of information.

The filing and document classification scheme should apply to the full spectrum of documents generated in an enterprise and should be applied to storage on local and network disk drives, manual filing, etc.

Again there are specific principles to be applied to this genre of classification scheme over and above the principles applied in this handbook.


10. Other lists

To the best of my knowledge the above categories apply to the full spectrum of information that it is required to catalogue and classify information in organizations.  Should you identify categories of information that seem to lie outside the above I suggest you look carefully at the possibility that the principles catered for in the above nine categories will somewhere cater for your data.

If you still cannot find a category that applies you are welcome to contact me.

The above categories cater for every type of list and provide a basis for formulating an approach to classifying and coding information.


Section 7.9

Important questions about any data


In considering developing taxonomies relating to any data keep in mind the following:

1.  What is the fundamental information in this table?

2.  What category of information and how do we code effectively? 

3.  Who will use it?

4.  How will they create value with it?

5.  Could we need this sometime in the future

6.  Is the information readily available or what will we do to obtain it?

7.  Who will be inconvenienced by obtaining this information?


Section 7.10

Steps in developing a hierarchy


Strategic engineered precision taxonomies (SEPT) require the development of highly structured taxonomic hierarchies, the steps in developing such hierarchies are as follows:

1.  Accurate identification of the list

Make sure that you clearly understand the purpose and the ambit of the list from careful consideration of the exact name of the list and also understanding of how the software references and uses the list elsewhere (if applicable).

I frequently encounter lists which contain content that bears no relation to the name of the list or the purpose of the list in the software.  Then people blame the software for not working correctly and build workarounds that get more and more complex and remove the operation of the software further and further from its original design.

It is vital to understand that it is extremely bad practice to use a list for something other than its intended purpose.

If you identify an information need and there is not a suitable list then it is preferable to add a user defined field rather than bastardize an existing list.


2.  Entity-relationship logic

Entity-relationships define the relationship between different logical entities and their corresponding data tables, thus, for example, a business has customers and customers have orders and orders have order lines.  Validation and other lists and fields should be incorporated on the data tables that are appropriate to the logic of the REAL WORLD.

Failure to do this will result in all sorts of apparently aberrant behaviour by the software and all sorts of workarounds, etc.  It is vital that the real world logic is accurately modelled.

If you are not familiar with the rules of entity-relationships I recommend that you find someone who is to advise you before you use a list for a purpose other than that for which it is intended.  It is no good setting up well designed content in a list that is in the wrong logical location in the database and then complaining that the software does not work properly.


3.  Start with a clean sheet

Start the design of the hierarchy with a clean sheet of paper / spreadsheet / worksheet, do NOT under any circumstances try and fix an existing list (unless you are cleaning up a really well designed list that has been badly managed) – you will waste large amounts of time and produce a sub-optimal outcome.

The human brain is a highly powerful, abstract, cognitive super-computer – use the existing lists as a source of brainstorm material but build the new taxonomy on a clean sheet.  See the article "The Power of an executive with a clean sheet of paper".


4.  Cascade

The hierarchy MUST cascade.  Indent each row down the hierarchy by one character in the form of a leading blank space.

This is vital in order to ensure that the hierarchy is easy to read by personnel posting against it in the future and also to ensure that the logic of the hierarchy flows smoothly.  The visual effect of the indents ensures that the hierarchy is easy to interpret.


5.  Capitalize headings

In building the taxonomy capitalize the headings and in application of the hierarchy train staff NOT to post to headings EXCEPT in the case of budgets and mappings which may post to headings. 

All possibilities that apply to a heading should be listed under the heading.

The use of capitals is also for ease of reading when posting and when summarizing reports.

Posting level lines should be in lower case with the first character of the description and proper nouns capitalized.


6.  Identify the type of list

Refer to the different types of list and make sure that you have correctly identified the type of list (and data) that you are working with and that a hierarchy is, in fact, applicable.  Note that there are distinct principles that apply to developing hierarchies for different types of data.


7.  Comprehensive view

Develop a high level view of the total ambit of the information required in the hierarchy through intuitive understanding and / or getting the right person or people in the room and / or through research.

Generally this means consulting with senior business people, particularly with regard to something like a group-wide Chart of Accounts or Item Master, etc.


8.  Push the envelope

Push the envelope in terms of possible future growth – consult with executives in terms of possible future growth and provide headings and gaps to accommodate foreseeable growth.


9. Develop major categories – 5 to 9 optimum


Formally or informally develop the major categories that describe the content of the hierarchy.  Generally aim for between 5 and 9 headings with the optimum being 7.


If there are 5 or less items look for ways to split some of the headings into more than one category and increase the number aiming for 7.

If more than 9 look for ways to group categories to reduce the number, aiming for 7.

With large hierarchies you may need to iterate several times before you get this right.

I consistently find that where I take more time to refine to close to 7 categories the final list is tighter and makes more business sense than lists with 5 or less or 9 or more items.


10. Multiple dimensions

Sometimes you will find that you come up with more than one set of equally valid groupings.

This may indicate that the naming of the list is too broad or is ambiguous in which case you may need to split the list into two or more attribute sets and add one or more additional user defined fields to the relevant data table.

Alternatively you may duplicate the second list down the first list for every instance to create a simulated matrix list.  The correct treatment for such a situation is to recognize that you have identified a matrix type of relationship and then to build the resulting matrix or cube in accordance with the principles applied to the Cubic Business Model for financial data.

The key consideration is to accurately model the real world.


11. Locations

Locations should follow a logical geographic progression that makes sense in the context of the geographic distribution of the organization – for example clockwise round the country, or the world, etc.


12. Functions

Functions should be arranged logically such that the most core functions are at the top of the list and the least core functions at the bottom.  A useful test is "is this something that I could easily outsource?" — if so this is NON-core.  If you cannot outsource it easily because it is a key differentiator or represents the essence of the business then it is CORE.


13. Iterate to fine granularity

Depending on the scale of the subject area iterate down the hierarchy in each segment until you reach the posting level as determined by the "screw metaphor"—that is small and unambiguously unique bins each of which contains data with one explicitly unique and mutually exclusive combination of attributes such that ALL permutations are catered for by explicit bins.

Take time to brainstorm and research ALL possible elements for any component of the hierarchy.


14. Element sequencing

Sequence the elements in any component from a strategic fundamental first principles view point such that the strategic (essential) elements are at the top of the list segment and the most operational (least strategic) are included at the end of the segment.


15. Multi-faceted hierarchies

Note that on large complex hierarchies such as the Item Master or Materials Master or for document filing schemes there may be different logic for different components of the hierarchy.  These will ultimately give rise to compound, complex code schemes.


16. Languageing the hierarchy

As you build the hierarchy language each level of the hierarchy very carefully so that reading down the hierarchy tells a very detailed story – a comprehensive and unambiguous reading down to the posting line.

This must take account of the different rules that may apply to different levels of the hierarchy – for example core operating consumables for an earth moving machine may be identified explicitly, as in the case of an air filter whereas seldom purchased body parts may be classified using a sequence number in the code scheme and only added when required,


17. Exceptions -- Other

Where "Other", "Unknown" or "Not applicable" are valid options provide for them at the end of the relevant hierarchy list components and code appropriately.

Note that there ARE times when one or more of these logical elements IS valid and needs to be provided.  If they are provided they should be coded appropriately and managed with appropriate exception reporting, that is a report listing all instances of "Other".

By way of example I nearly always code "Other" as "9" in a numeric code scheme or "Z" in an alpha or alpha-numeric code scheme so that it is at the end of the list element.  The fundamental logic is that operators must scroll past all valid options before selecting "Other" and that accordingly "Other" will only be used under exceptional valid situations.

Basically "Other" should only be used when an operator requires training as to where to post or where some instance occurs where there genuinely is a transaction that is not catered for in the body of the code scheme.  In the first instance training should be given and in the second an additional code should be added if "Other" is occurring reasonably frequently.  With this philosophy "Other" is valid and should be catered for and managed.

During implementation it is recommended that reports are produced to list all instances of "Other" so that they can be managed as suggested above.


18. Calibration

Once the lists are thought to be complete, hold up the new lists against the old lists and tick off line by line to ensure that everything on the old lists is catered for on the new lists.  Sometimes this can be done as part of the mapping process linking old to new codes but this checking should generally take place well before the mapping stage in order to avoid having to add codes during the mapping process.  This will ensure that the mapping process will proceed quickly and smoothly.

The above is an outline of considerations and steps in the development of a hierarchy.  I hope to produce more detailed material in due course.


Section 7.11

Steps in coding a hierarchy


Strategic engineered precision taxonomies (SEPT) require the development of highly structured taxonomic code schemes linked to the hierarchies.  The steps in developing such code schemes are as follows:

1.  Build the hierarchy keeping coding in mind

As you build the hierarchy take account of how you plan to code taking account of the different coding styles that are available to you.


2.  One level at a time

Build the code one level of hierarchy at a time – follow the colour coded columns corresponding to the indents of the hierarchy and work all the way down from top to bottom adding codes at the start of each level of indent and then spacing codes out over the remaining section of the hierarchy.


3.  Use one character per indent

Most frequently you will use one character / letter / number for each level of hierarchy but in some cases, primarily with complex code schemes of the Item Master / Material Master / Product Master genre you may use more than one character.  In such complex hierarchies you may use different code patterns for different levels of the code hierarchy.


4.  Gap code

It is vital that you gap code – at every level of the code scheme spread the code out as much as you practically can leaving larger gaps in areas where it is most probable that further detail might be added in future.


5.  Follow list sequence

The code sequence MUST follow the list sequence.

If while coding you see an opportunity to improve the list sequence then change the list sequence and code accordingly.

Where you change the list sequence please notify other team members of your action in order to avoid "people" problems later.


6.  Mnemonic is preferred

Mnemonic alpha coding is always preferred with the mnemonics corresponding to the hierarchy.

There are, however, distinct rules that apply in large code schemes.


7.  Delimiters

Codes should be structured in segments with delimiters such as "-" (preferred), "/", "_" or "." depending on the code scheme.  Multi-segment codes such as the Cubic Business Model Chart of Accounts should have segments delimited.  Most software can handle "-" or "." as a delimiter and these have the advantage of being on the numeric pad, some people favour "/" which is also on the numeric pad.  Once you have chosen a delimiter stick to it.

Where a code element, such as the Chart of Accounts exceeds four characters in length this should also be split into segments.  The human brain interprets and remembers three character or four character blocks most readily so code segments should be kept to between three and four characters wherever possible, for example 172-9343-013.


8.  General ledger coding

In the case of general ledgers there are usually accounting and business requirements that dictate the sequence of the lists and this points to numeric coding.

In addition, most accountants prefer numeric coding on the basis that it is allegedly faster and more accurate for bookkeeping staff.  However, I have encountered accountants who prefer alpha-numeric – decide the coding convention before you start coding.


9.  Alpha sequence code

In cases where the code scheme is very cramped you may use Alpha as a sequence code with no correlation between the letter used and the corresponding list entry.


10. Mnemonic logic

In mnemonic coding the progression of logic is as follows:

a.  First letter match

b.  Next matching consonant

c.  Letter sequence

d. Relevant vowel

e. Number

The goal is to follow the sequence of the hierarchy with coding that is most intuitively easy to remember.


11. Strategic (essence) logic leads

Note that the strategic (essence) logic of the sort order is more important than the ease of remembering as the human mind has great capability to remember patterns.


12. Check digits

Sequence number coding should, as far as possible, always include a check digit in cases where several characters are allocated to the counter.


13. Sort order

When coding make sure that the sort order of the code always correlates with the physical position sort of the hierarchy.


The above is an outline of considerations and steps in the coding of a hierarchy.  I hope to produce more detailed material in due course.


Section 7.12

Coding steps


The following steps should be followed in developing codes:

1.  Exception handling

a.  Not Applicable, No Information and No Code (Z00, ZNA, ZNI)

b.  Always a place to post EXACTLY


2.  Ease of interpretation and remembering

a.  Mnemonic where possible

b.  Alpha numeric where mnemonic is not possible

c.  Numeric where alpha is not meaningful e.g. chart of accounts


3.  Contiguous bracketing

a.  NO gaps

b.  Codes cover entire possible range e.g. "End of ..."

c.  Codes for start and end of range


4.  Consistency across lists and entities

a. Same items same structure and code everywhere e.g. assets, depreciation, insurance, repair and maintenance, etc


5.  Conventions

a.  Capitalization

b.  Indents

c.  Trailing periods

d.  Delimiters

e.  Abbreviations


6.  Single entity per list UNLESS by conscious CHOICE -- Model full multi-dimensionality


7.  Generate complete lists and audit reports

a.  Duplicate standard modular blocks

b.  Reports to audit postings

c.  e.g. rigorous analysis of GL


Section 7.13

Critical implementation considerations


Following are some critical considerations in implementing SEPT and Precision Configuration:

1.  Radical change

SEPT and Precision Configuration are a radical change compared to what your organization has today (else you would not consider the investment) – some staff will intuitively see the value and actively embrace the new way of working but many will be unsettled and some WILL resist.


2.  Trash the old ways of working

A wide range of historical ways of working, protocols, policies, standards, procedures and processes will be trashed or radically changed and some staff will be offended and oppose the change.


3.  Minds go blank

The mental reaction of most human beings when confronted with something new and unfamiliar is to "go blank" – for this reason there must be comprehensive communication with, and involvement of, staff during the design and implementation process.  Use of a laboratory for testing and training is recommended – see the article "Defining an ERP implementation laboratory".

Staff must be facilitated through the difficult transformation and the services of a change facilitation advisor, preferably with a degree in psychology, is recommended on larger projects.


4.  The Old reports

The default requirement with any new taxonomy is to produce "the same reports as we had before" – this is understandable but is NOT recommended.  Remapping the new taxonomies onto the old reports can be a time consuming and painful process and is NOT recommended unless the old reports are really well designed.

It is better to design new reports from the ground up (blank sheet of paper) exploiting the design of the new taxonomies and then transform the historical data to the new mappings and run the new reports against the old data.

If it is decided that the old reports must be recreated then it is vital to understand that this is a time consuming and frustrating process which does NOT say anything negative about the new design.

Note that in producing the new design consideration should be given to standard reporting requirements although, given these were derived in an environment of badly structured data care is required in making such historical references.

The blank sheet of paper is the preferred route.


5.  Blame the new

Inevitably it takes time to debug and define reports, ETL, etc and when problems are experienced it is all too easy to blame the new configuration and suggest that somehow it is fundamentally defective.

Provided the taxonomies have been developed in close consultation with management and staff and comprehensively reviewed it is extremely unlikely that there will be any significant structural defects in the code schemes – the reaction is simply a natural negative reaction to change and things which are not yet fully understood.


6.  A system implementation

The implementation of new code schemes in an existing technology system, whether in an ERP, Data Warehouse, Business Intelligence environment or other system have all the characteristics of a full-blown system implementation.  It can therefore be expected that all the problems and challenges associated with such an implementation will be encountered and must be managed effectively.


7.  Lack of knowledge of what is possible

Most people are not familiar with advanced graphical, statistical and other analytical techniques and accordingly executive level advisory services to assist with the development of advanced reports, models, etc should continue for at least a year after commissioning of the new taxonomies.


8.  Appoint an analyst

In medium to large client organizations we recommend the appointment of a senior or mid-level staff member or contractor with formal training in statistics and data analysis techniques, economics, etc and equipped with advanced analytical tools.


Section 7.14

Conventions and standards


Strategic engineered precision taxonomies (SEPT) are THE way to give executives REAL information:

1.  Not about technology, about INFORMATION

2.  Strategic understanding

3.  Fundamental first principles

4.  Long term view

5.  Complex, challenging and costly BUT substantial net value

6.  Perhaps the greatest "I.T." BUSINESS VALUE opportunity at present

7.  Do not scrap your existing systems UNTIL you have thoroughly evaluated and costed this option - look at customisation and re-implementation


Section 8 -- Case studies and white papers


Section 8.1

V3 ERP Implementation case study -- headlines


The headlines of the V3 ERP Implementation case study are as follows:

1. ERP that James Robertson was involved in architecting and designing

2. Cubic business model based on Chart of Accounts resulting from 1,000 hour investment

3.  "More management information than we know what to do with" – very happy client

4.  One less bookkeeper

5.  Audit complete in six weeks, previously six months

6.  Balance sheet unqualified for the first time in fifteen years

7.  Presentation with client – greatest recommendation


The Benefits of Management Information Systems to the Professional Practice

SAICE 15th Annual Conference on Computers in Civil Engineering

By

Dr James A Robertson PrEng & Reg M Barry, Financial Director, V3 Consulting Engineers


SYNOPSIS

The advent of commercially available practice management software for the South African Consulting Engineering Industry some years ago, introduced the possibility of introducing far reaching, tailored, management information systems into the professional practice. This paper sets out to highlight some of the experiences and particularly the benefits derived from one such installation two years after implementation. The system comprises an integrated job costing, billing, debtors and creditors system linked to a comprehensive financial management system and an executive information system offering a wide range of management reports and graphical analysis.

Benefits experienced include the reliability and timeousness of the information, financial results are typically available within ten days of month end and year end financials within the same time frame at reduced audit cost and greater precision. A wide variety of reports are available and the organization can be viewed as a "Rubics Cube" of information in which the information can be grouped and examined in a wide variety of ways allowing project, client, profit center and other views of performance according to management's needs. Full activity based financial analysis and overhead distribution is supported eliminating the approximations typically made in assessing profit distribution and recognizing marketing and management contributions.

Senior management have had their workloads on mundane analysis greatly reduced while obtaining more accurate information faster. Information is also available at different levels of the organization at different levels of detail. Enquiries from a very summarized executive view to a very detailed transaction level analysis allow effective management by exception with drill down to specific problems. The variety of analyses possible offers great scope for effective management and directed marketing in a manner which should allow the company to create and sustain competitive advantage.


INTRODUCTION

The evolution of computer technology in the late eighties gave rise to a situation at V3 Consulting Engineers in 1989 where the existing projects system was becoming obsolete and no longer able to cope with the demands of the firm. Over the period 1989/90, the management of the firm undertook a number of preliminary reviews of commercially available software and subsequently commissioned a detailed study of the firm's requirements in which the relative strengths and weaknesses of the commercially available software packages was evaluated (Robertson 1990).

It was established that neither of the major packages available were ideally suited to the needs of the firm and further analysis was undertaken to establish in greater detail the scope of modifications required. Following negotiations with the vendors, a scope and budget for the required changes was agreed and a final decision taken as to which system to purchase. The selected system was a South African developed package already in use at a number of consulting engineering firms.

A period of software enhancement by the developers was followed by testing and pilot operation, the system was commissioned and ran live in the Cape Region of V3 in October 1991. Thereafter the system was installed in the Free State and Transvaal regions, running live from March 1992.

This paper outlines some of the experiences with the implementation with particular emphasis on the benefits derived from the use of the system.


SYSTEM OVERVIEW

The system selected comprised a number of major components:

Projects System

The projects system comprises a suite of programs including projects and personnel databases, salary and rates information. A company parameters module allows configuration of the system to model the organizational structure of the practice to take account of offices, departments and associated companies as well as to define the nature of the general ledger interface. A variety of set-up options allow further customization of the operation of the software.

The projects system provides full features for the entry and processing of time and expense information with comprehensive analysis of Work in Progress (WIP). WIP is maintained on an open item basis such that once captured, all items remain in the system until they are either recovered through billing to the client or written off. Full audit trails and analysis reports are available on the WIP. The project system includes a largely automated billing system.

The projects system also provides a wide range of facilities for structuring up to 5 levels of project detail and associated analysis together with activity codes and a variety of project budgeting and reporting options.

The projects system is integrated with debtors and creditors modules to allow full management of these accounting functions with project related reporting in debtors and both project and non-project expenses posted in the creditors program.

All financial components of the projects system are integrated on a batch basis with a commercial general ledger package.

Financial System

The financial system comprises a commercial general ledger package together with integrated cash book software. This is linked on a batch basis to a commercial salary package. The financial system has recently been extended by the acquisition of an integrated assets register package and barcode reader. The financial system replaced 24 column manual cash books.

The general ledger chart of accounts accommodates a comprehensive, fundamental analysis of all income statement and balance sheet items in a manner that is linked to the business model of the organization in terms of cost and profit centres including physical branch offices and administrative, technical and support departments. A hierarchical, structured coding scheme is employed in order to facilitate allocation of expenses on an activity basis, and to allow progressively more detail in enquiries. Associated with the chart of accounts, a variety of financial reports allow summary or detail reporting for the region, office or department as required, including summary and detail income statements, balance sheet, cash flow projections and ratio analysis.

The financial system is linked directly to the projects system in a manner that is designed to support activity based costing and allocation of income and expenses in a manner that permits clear definition of ownership of information with a view to achieving a high level of internal auditing and a resultant improvement in accuracy and reduction in audit delays.

National Consolidation

In the past year, procedures have been implemented to permit all financial results to be consolidated nationally at the detail level, thus permitting the extraction of a wide variety of detailed and summary analyses. Various controls on inter-region charges have also been implemented together with procedures for accumulation and distribution of corporate overheads.

Executive Information System

Recently a graphical Executive Information System (EIS) has been developed to operate on the underlying operational projects and financial systems. This EIS has been developed using a commercial, windows based tool and provides a high level of graphical summarization of certain key values in the projects and financial systems. Development is continuing.

The EIS system has been developed with the objective of enabling senior management to see key values summarized graphically in a meaningful way that allows them to rapidly identify potential problems and drill down to the detail in any way that they may consider necessary. Particular emphasis was placed on achieving a user interface that was intuitive for senior management and did not restrict enquiries on the basis of simplifying assumptions made during construction. The EIS also provides an interactive mechanism for overhead distribution on an activity basis, whereby all income and expenditure relating to non-production business units is distributed over the production units on an agreed basis. The model has been designed with a view to providing management with the means to examine the effect of alternative allocation formulae on the profitability of individual business units without altering the underlying data which has been allocated on a fundamental basis.

The ultimate objective set for the EIS is to support a "paperless board meeting" in which all relevant information is projected onto a screen in the board room so that managers can analyze and query information interactively and pro-actively thus facilitating management by exception rather than tabling large volumes of information.


OBJECTIVES FOR THE SYSTEM

A number of short term and long term strategic objectives were set for the system at the time that the initial investigation (Robertson 1990) was undertaken. Particular emphasis was placed on specifying the objectives and requirements for the system with the objective of meeting the long term strategic requirements of the firm with a view to avoiding the need to replace the system after a few years. Objectives set included:

- Provide tools to monitor and improve productivity and profitability.

- Enable profitability to be measured on a project, department and office basis using the cubic model proposed by Robertson.

- Assist the firm to offer the highest possible levels of service to it's clients.

- Ensure that charges for work were realistic and that work was performed effectively for the client.

- Provide comprehensive budgeting facilities for projects and financials.

- Assist in the evaluation of current and future directors with respect to appointment and promotion.

- Provide concise management summaries.

- Permit a global view of the practice.

- Permit detailed enquiry on all aspects of operations and job costing.

- Require minimum management time and manpower to operate system.

- System must be affordable.

All of these objectives have been met at the current time although costs have been greater than expected and would be handled differently if the project was undertaken today. Certain specific benefits are discussed in more detail in subsequent sections.


IMPLEMENTATION EXPERIENCE

The implementation was undertaken in a phased manner, as outlined previously. Problems were experienced in terms of availability of senior personnel in-house at certain times and in terms of commissioning the system in other regions using in-house personnel. This was undertaken with a view to cost containment but ultimately gave rise to increased costs associated with correction of problems experienced.

With hindsight, more use should have made of outside assistance in the implementation in the second and third regions. In-house staff were not experienced enough and the time they spent in other regions placed pressure on their own region's operation.

Time taken to achieve understanding and commitment to the new system by managers and staff at all levels proved to be greater than anticipated and required focused and firm action by top executives before all required information was provided by project leaders and other staff and proper use was made of management reports. Experience tends to support the widely reported view that a paradigm change of this magnitude requires between three and five years to become permanent in an organization.


BENEFITS OF THE SYSTEM

The projects system has now been in operation in the Cape Region of V3 for close to two years and in the rest of the country for eighteen months while the financial system has been in use country wide for eighteen months. As stated above, the objectives set three years ago have all been met. Specific benefits are discussed in the sections that follow:

Reliability and Timeousness of Information

Information is readily available, in many cases almost instantly. For example, analysis of time sheet data and other data captured to projects is available within two working days of the end of the month.

Full analysis of project performance for the month is available immediately data capture is completed including a wide variety of budget, costing and profitability reports. Up to date sales journals are available at any stage as are debtors and creditors age analyses. The EIS projects analysis can be made available within twenty four hours of month end or updated more frequently as appropriate.

Full financial statements including summary and detailed income statements, balance sheets and cash flow projections are generally available ten days after month end and include all closing and balancing adjustments for the period in question so that there is considerable confidence in the reliability of the information. The EIS financial analysis can be made available at the same time.

Because of the wide variety of combinations and groupings in which the information can be presented and the wide variety of controls built into the system, it is possible for all information to be reported in a manner which allows recipients to accept full ownership of specific sets of data. This facilitates verification and control and allows senior management to operate on the basis that, "if all subordinate managers have accepted the accuracy of their figures, the consolidated figures must be correct". This ensures a high degree of reliability and confidence in the information.

As a result of the detailed analysis contained in the general ledger, it is possible to operate the financial system in such a way that very little additional processing is required at year end over that required at month end. While some difficulties were encountered at the end of the first year of operations since not all procedures were fully in place, it was still possible to table the year end figures 17 days after the end of the year and they were signed off without qualifications by the auditors approximately five weeks later.

The Cubic Business Model

The business model referred to earlier allows the databases to be viewed as a multi-dimensional "Rubic's" cube which can be rotated and viewed in a wide variety of different ways. This permits the financial and production information to be grouped and summarized by office, department and region. Production (project) information can also be viewed by project leader, technical director, marketing director, client market segment, project discipline and client thus providing a fully market focused information capability. This information can then be used to focus marketing efforts and identify different marketing and management styles required for different market sectors as well as enabling management to evaluate the performance of individuals in terms of marketing and management contribution as well as production contribution.

In conjunction with these facilities, the activity based allocation of administrative overhead contribution by technical staff permits an accurate measurement of true profitability of individual business units or sub-units at a level which permits "level playing field" comparisons of business units. This eliminates the traditional problem of professional service organizations where the business units of those involved in management and marketing are penalized since only the production contribution is measured. Through this approach, inappropriate management decisions resulting from incorrect cost allocation can be avoided.

The system also supports attribution (allocation) of income from professional fees to the business unit employing the person doing the work. This permits the profitability of business units to be measured in terms of true, salary linked, revenue contribution as well as by the traditional method of project profitability and reduces the dependence on relatively arbitrary, rates based, costing approaches.

Senior Management Work Load and Effectiveness

Senior management have had their work load on mundane analysis greatly reduced as many of the analyses previously performed using spreadsheets have been incorporated into the system and are therefore available automatically with greatly reduced effort. Time spent resolving problems of mis-allocation and addressing queries with regard to year end has also been considerably reduced.

The multiple levels of summarization in conjunction with the high level of detail of the underlying data enable management to receive very summarized reports for routine management while affording them the capability to rapidly "drill down" to progressively more detail in order to answer queries.

Strategic Advantage

The wide variety of analyses available and the ready availability of information have freed management to be more effective while devoting less time to management and administration. At the same time, management have greatly improved scope to identify opportunities to improve operational effectiveness, increase delegation and improve profitability. They are also able to identify market related factors that can have a bearing on marketing strategy, product mix and other matters. These factors all enable the firm to offer innovative and competitive services in a competitive market. This is expected to assist the firm in creating and sustaining competitive advantage over the medium- to long- term as part of it's commitment to providing relevant, appropriate and cost effective services.


CONCLUSION

The components of a management information system (MIS) and associated financial and executive information systems have been summarized based on the experience of V3 Consulting Engineers. Certain experiences during implementation have been summarized and the objectives set for the system at the outset are reviewed. It is noted that these objectives have been met.

The benefits experienced by the firm are discussed with particular reference to issues such as timeousness and reliability of information, flexibility of analysis and control. It is noted that the work loads of senior management have been reduced while more accurate and detailed information is made available more rapidly. The ability to summarize the information in a great variety of ways while providing the ability to undertake enquiries at a very high level of detail when required, is noted as a further benefit.

It is concluded that the system has met most of the objectives set for it at the outset and that it is assisting the firm in it's objective of creating and maintaining competitive advantage through the provision of focused, appropriate and cost effective consulting engineering services.


REFERENCES

Robertson J A (1990) Report on Investigation Into Professional Practice Management Information Systems for Vorster, van der Westhuizen and Partners Unpublished report, October 1990.

September 1994

Download the V3 Consulting Engineers: The Benefits of Management Information Systems to the Professional Practice -- Article in Adobe pdf format


011 The Benefits of Management Information Systems to the Professional Practice -- by Dr James A Robertson PrEng from James Robertson


Download The Benefits of Management Information Systems to the Professional Practice v 003 -- Slides in Adobe pdf format

Download The Benefits of Management Information Systems to the Professional Practice v 003 -- Original Paper in Adobe pdf format


Section 8.2

CRM Risk Control case study -- headlines

The headlines of the CRM Risk Control case study are as follows:

1.  A simple software application

2.  Specified in two (2) days

3.  Built in ten (10) days

4.  Data engineering with full time executive input and facilitation ten (10) days

5.  Extremely diverse range of management information

6.  Four (4) operators captured about eight (8) times more information than twelve (12) operators would have captured previously

7.  Primarily a Strategic Engineered Precision Taxonomy (SEPT) and Precision Configuration benefit

8.  Presentation with client – greatest recommendation


Designing and Implementing an Integrated Risk Management System that Effectively Minimizes Your Exposure

Integrated Risk Management Conference

By Dr James A Robertson PrEng and George J Paton, Director, CRM Risk Control Consultants


SYNOPSIS

The management of risk in organizations today is becoming of increasing importance as insurance premiums and liability risks increase and as the hidden costs of risk in areas such as down-time, customer dissatisfaction and other factors increase.

Effective management of risk is therefore becoming a strategic necessity. Risk management in the area of physical risk is an aspect of business that is frequently overlooked or is approached on an ad-hoc basis. This paper sets out some of the factors that should be taken into account in implementing risk management solutions and identifies the need for such solutions to be holistic in nature. In particular, it is noted that the physical and financial components of risk management should be tightly integrated and that the management of maintenance on a risk containment basis is highly desirable.

It is concluded that the effective application of information technology in the form of an integrated loss acquisition database and management information system is vital to achieving the full potential of risk management in any organization. Some of the benefits of this approach are discussed together with a case history of a successful implementation.

It is concluded that the application of these techniques can give rise to a considerable improvement in profitability and should be a vital component of most organizations business strategy. Effective risk management supported by effective information systems can play a significant role in creating and sustaining competitive advantage.

1. INTRODUCTION

The management of risk in business today is a many faceted and complex task. Traditional approaches to risk management have focused on funding and financial issues rather than managing risk at source. As with maintenance, risk management has tended to concentrate on treating the symptoms rather than the cause. Events giving rise to large losses tend to originate from apparently insignificant occurrences with regard to wear and tear, maintenance and personnel which, with time, escalate to a point of giving rise to a major incident. The use of appropriate techniques to track small losses in a manner that enables management to analyze trends in such a way that proactive action can be taken to anticipate and prevent major losses and to identify the true cause of recurrent losses is vital to effective risk management that offers bottom line benefits.

In developing and implementing a risk management solution, it is important to recognize that a prime objective of the risk management function is to create a risk awareness culture in the organization in which there is an understanding of the adverse effects that risk exposure will have on the organization. As a consequence of this awareness and understanding, deliberate measures to minimize the potential impact on the organization should be implemented. A fundamental principle of risk management is a change in emphasis from an approach of contingency planning in the event of occurrence to proactive management directed at preventing risks from materializing. Risk management is therefore primarily a management function aimed at dealing mainly with uncertainties whilst taking cognizance of the consequences of pure risk and it's impact on business activities.

In designing a risk management solution, a number of tasks must be performed:

a.  The potential impact of hazards on the effective operation of the business must be considered.

b.  Steps necessary to achieve predefined objectives must be defined.

c.   Risk improvement programs to reduce the probability of occurrence of risks must be developed.

d.  Alternative strategies for controlling the consequences of risk and their impact on the organization must be developed.

e.  These strategies must be integrated into the general decision framework of the organization.

Management activities associated with this process will include risk identification, risk evaluation, risk control and risk monitoring. Risk control involves selecting and implementing the solution most appropriate to achieving the given objective while risk monitoring focuses on determining the outcomes in order to assess the validity of the decisions made. Risk management must take place at all levels in the organization.

In determining the cost of risk, in order to measure the effectiveness of a risk management programme, factors such as insurance premium costs, retention costs such as risk control expenditure, maintenance programmes, training costs, fire protection, security and administration costs must all be taken into account. An optimum risk management solution will maintain a balance between the cost of risk improvement and the level of risk financing with the objective of achieving lower levels of risk in conjunction with greatly reduced overall levels of expenditure as shown in figure 1.

In accomplishing these objectives, a means of acquiring and analyzing comprehensive and detailed loss statistics in order to determine the impact of risk management decisions and to identify problem areas requiring attention, is highly desirable. In fact, it is unlikely that the full long term benefits of a risk management program will be achieved unless the risk management program is supported by a comprehensive information system capable of recording all relevant loss information in a manner that supports comprehensive analysis and enquiry.


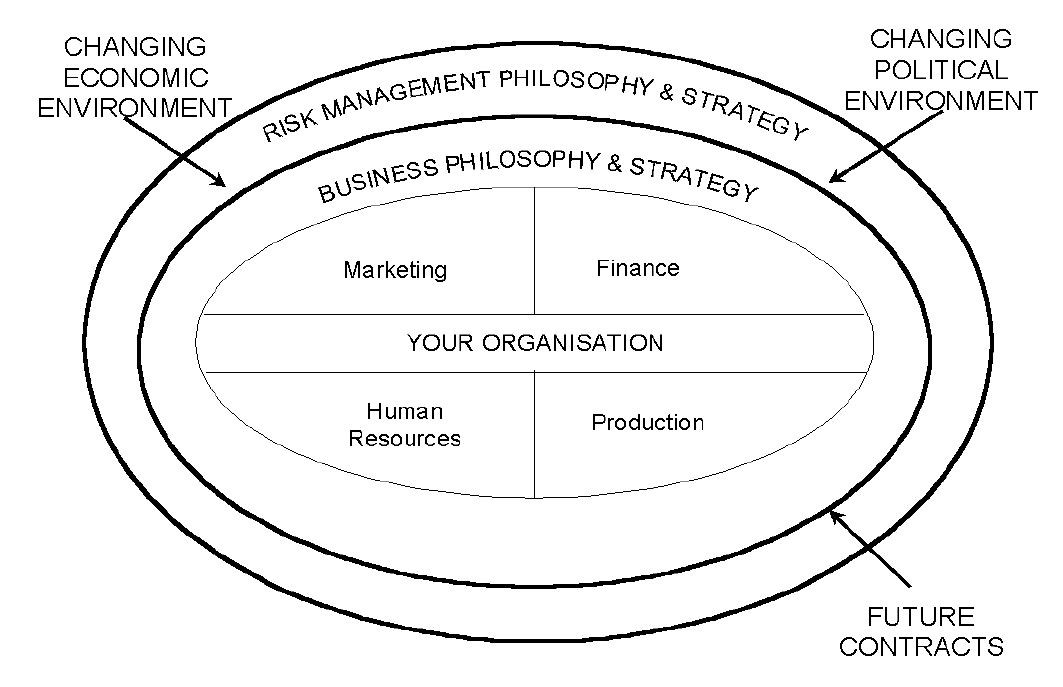
FIGURE 1 : DETERMINING THE COST OF RISK


2. DEFINITIONS

In discussing risk management in the context of designing and implementing a solution, the following terms are applicable (Valsamakis, Vivian, du Toit, "The Theory and Principles of Risk Management" 1992).

a.  Risk management

Risk management comprises a comprehensive range of activities for dealing with risks. As a science it identifies the methods that can be adopted to handle risks and to show the interdependence between the available alternatives. As a management function, it is used to plan, direct and coordinate activities in the pure risk area.

Figure 2 illustrates the relationships between business strategy, risk management and external influences.

Figure 3, based on the work of the Society of Risk Managers, illustrates the areas covered by risk management and the overall objectives of an organisation.

b.  Pure risk

Pure risk is a risk which results only in loss, damage, disruption, injury or death with no potential for gain, profit or other advantage.

c.   Risk control

Risk control comprises the provision of appropriate levels and standards of protection for people and assets to avoid, transfer, control of or acceptance of the pure risks which have been identified and evaluated.

d.  Risk financing

Risk financing involves the provision of funds for recovery from potential losses that do occur.

e.  Risk evaluation

Risk evaluation is the expression of identified pure risks in an organisation in quantitative / qualitative terms in order to gauge the potential severity and frequency of occurrence of these risks.

f.   Risk identification

Risk identification is the identification of the pure risks to which an organisation is or could be exposed.

Risk can be defined as the difference between what is expected and what is experienced. In figure 4 item (a) has a greater uncertainty than item (b) and there is therefore a greater probability that the outcome of item (a) will deviate significantly from the expected value with the resultant impact on operations and severity of loss.

g.  Pure risk improvement techniques

Pure risk improvement techniques are those techniques which are used to provide appropriate levels and standards of protection for people, assets and earnings. The four main techniques are as follows:

Avoidance - taking action so as not to incur the risk in the first instance.

Retention  - acceptance of the risk in its current make-up or character.

Transfer    - insurance, non-insurance or contractual transfer of the consequences of risk.

Control      - reducing the risk by controlling its frequency and its severity.

h.  Risk finance

Risk financing is intended to provide funds to assist the business to survive and recover from losses that do occur. The two main risk financing components are internal and external financing.


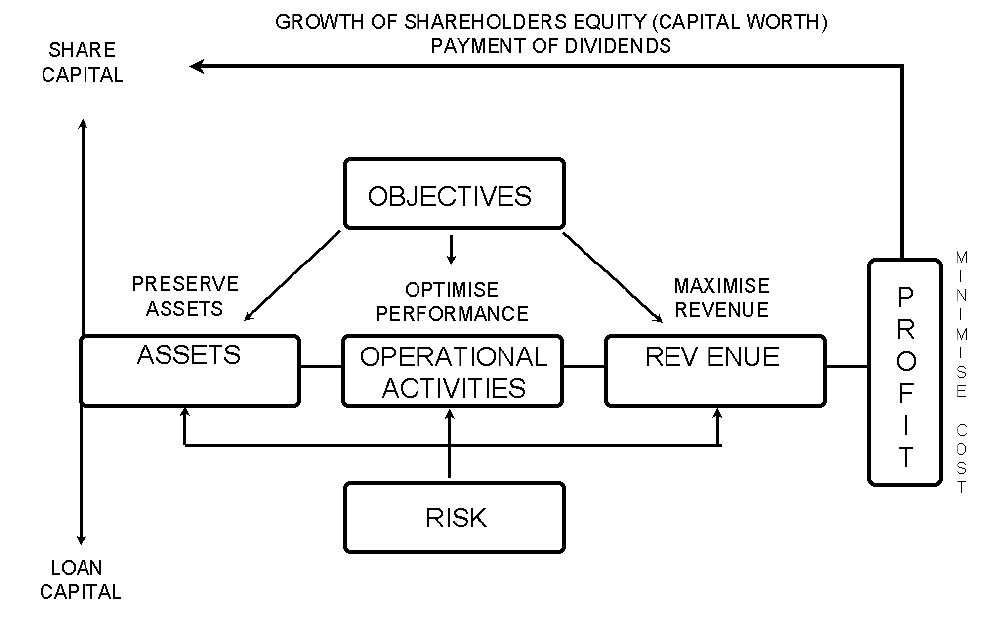
FIGURE 2 : THE RELATIONSHIPS BETWEEN BUSINESS STRATEGY,
RISK MANAGEMENT AND EXTERNAL INFLUENCES

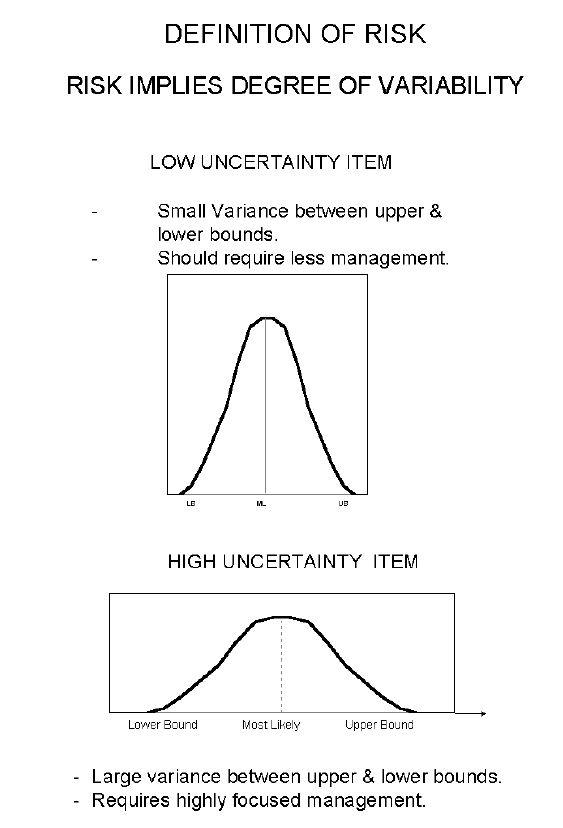
FIGURE 3 : AREAS COVERED BY RISK MANAGEMENT AND THE

OVERALL OBJECTIVES OF AN ORGANISATION

FIGURE 4 : DEFINITION OF RISK


3. PHYSICAL FACTORS GIVING RISE TO EXCESSIVE RISK

Traditionally, the focus of risk management has been on the recording and reporting of claims as they relate to insurers. As a management tool, this did not really identify the real risk exposure of the organization. The tendency today is to focus on the overall cost of risk in an organization which is not only the insurance related cost of risk.

Physical factors that can exacerbate risk are diverse and include maintenance issues, health, environmental and other issues. A few aspects are discussed below.

The maintenance of complex plant, particularly in the production environment is often undertaken on a basis of maintaining the most visible items rather than on maintaining those items that have the greatest potential to give rise to losses or increase risk. For example, a decision to save money on the price of a valve or other low cost component can give rise to greatly increased down-time or even catastrophic failure of the plant. Most maintenance programs do not take account of these factors. An effective risk-focussed maintenance management system will focus on the loss implications of failure of a particular component and prioritize maintenance accordingly. This approach requires a different mind-set in the maintenance department and the provision of appropriate tools to enable the maintenance manager to allocate maintenance resources according to the loss implications of failure rather than traditional criteria. Sophisticated computerized information systems are required in order to accomplish this objective.

In practice, it is not uncommon for losses to result from apparently unrelated circumstances. A recent example involved a major transport operator where it was found that a disproportionate number of drivers suffered from diabetes and that their blood sugar levels were dropping in the afternoons as a result of inadequate diet to a level where serious accidents were more frequent than the industry norm. In another case, drivers were waking at 1 am in order to get to work on time and were losing concentration by mid-morning as a result of exhaustion. Many of these situations are never identified or are only identified in response to a decision from insurers to increase premiums because of poor claims history.

With appropriate information systems it is possible to monitor loss experience and identify unusual trends at an earlier stage. Under certain circumstances, it is also possible to identify relationships for more direct investigation thus reducing the time required for manual investigations.


4. INFORMATION NEEDS IN ORDER TO IDENTIFY TRENDS FOR PHYSICAL RISK CONTROL

Experience has shown that major incidents are normally preceded by a number of minor incidents over a period. Typically, such minor incidents do not attract attention and, in many cases, are not reported so that their occurrence is only highlighted during the investigation that follows the major incident. Appropriate use of a loss information recording system will enable these trends to be highlighted in terms of aggregate cost of risk, frequency of occurrence, etc. Such a system will also enable management to track the full scope of losses occurring and in some cases may highlight that the real cost of small losses exceeds the cost of the high profile losses which constitute the normal focus of attention.

Conventional loss reporting concentrates on the amount claimed from insurers rather than the hidden costs associated with the loss which includes down-time, management time, lost production, lost market opportunities, customer dissatisfaction, unremunerated overtime, staff dissatisfaction and other factors.

Compounding the above difficulties, it is frequently found in many organizations that the personnel responsible for risk control and risk improvement rarely communicate with the personnel responsible for making the financial decisions regarding insurance and self-insurance levels. In order to make strategic decisions with regard to the financial component of risk management, there is a clear need for organizations to restructure these functions resulting in a single line of responsibility for all risk related management as indicated in Figure 1. Tightly integrated risk management information is a vital component for achieving this objective.

In order to fully accomplish the objectives set out above, it is necessary to establish effective communication between the risk improvement and financial functions in order to ensure an integrated approach to risk management. The effectiveness of this communication can be greatly enhanced by having systems which will enable the full financial implications of past losses to be reported thus enabling the full implications of proposed risk management decisions to be accurately projected. This will, in turn, give rise to far better decisions with a long term impact on the profitability of the organization.

A prime requirement indicated by the above discussion is the need for a single integrated database of all risk related information in order to support a single basis of risk related decision making. In addition to information pertaining to incidents that occur, this database should include planned maintenance information, risk audit statistics, information about unaccounted losses, (those losses normally recorded elsewhere but which contribute to the cost of risk such as wear and tear) and other statistics normally recorded separately.

As an example, an organization involved in the introduction of ISO 9000 certification concluded that they were not being particularly effective in their maintenance programs. It was therefore decided to create a database of all major items such as boilers, pressure vessels, etc as well as all other equipment and to associate this database with a database of all relevant legislative requirements. Based on this database, maintenance of all plant and equipment was prioritised and scheduled and it was found that, whereas when the idea was first mooted, increased costs were anticipated, the overall cost of running the plant was reduced and plant efficiency was increased.


5. THE BENEFITS OF ESTABLISHING AN INTEGRATED LOSS DATABASE

The business case in favour of establishing an integrated loss database has been set out above, some of the benefits of such a database are listed below:

a. An integrated loss database will make it possible to introduce a holistic and consistent risk improvement program across the organization in order to enable a standardised approach to be adopted toward financial, and physical risk management.

b.  Accountability for losses and risk management can be effectively established by incorporation of an appropriate business model and business rules into the database in such a way that every item can be uniquely associated with a single responsible person who has final accountability. Consideration of these factors during the implementation of the system will frequently cause the organization to identify issues for which accountability has not been effectively defined.

c.   The true cost of risk, including hidden costs and high frequency, low value, unaccounted losses, can be established so that management can adopt a pro-active approach centred on reducing the total cost and not only the visible cost.

d.  The quality of pure risk management will be greatly improved and duplication of effort will be avoided.

e.  Early identification of adverse trends will minimize the probability of the occurrence of catastrophic loses and improve the ability of management to isolate those aspects of business operation that are most at risk of catastrophic loss. This in turn will enable informed decisions to be taken with regard to the need for disaster recovery and business continuity.

f.   Accurate centralized information will simplify risk management and reduce risk management costs for comparable results or, more importantly, give rise to a greatly improved return on the risk management investment.

g.  Accurate loss and risk management information, centrally available, will give rise to more effective decision making and enable management to see "the big picture". A well designed information system will also support distributed operation so that unit, plant, regional and corporate management will all have access to the components of the database of relevance to them. This will also enable management to benchmark similar business units across the organization in order to identify favourable and unfavourable trends in certain units. This has the potential to greatly improve the dissemination of information with regard to risk management practices that are delivering particularly noteworthy returns.

h. These facilities will also greatly enhance the ability of risk managers at all levels to adopt a coordinated approach to risk management.

i.    By providing effective summarization and drill down capability, it will be possible for management to focus on the key issues in risk management within the organization at any time.

j.   An effective risk management information system will also provide the tools necessary to ensure that insurance policy endorsements and limitations are constantly monitored thus greatly reducing the risk of policies being revoked due to non-disclosure or other considerations. A comprehensive risk management information system will include policy information at a level that allows full insurance policy management including aggregate management and other funding factors to be taken into account.


6. CONCEPTUAL REQUIREMENTS FOR THE IMPLEMENTATION OF AN EFFECTIVE RISK MANAGEMENT SYSTEM

Paton (1993) has discussed in detail the requirements for implementing a risk management system while Robertson (1992 1&2 and others) have discussed the implementation of computerized information systems. These publications and other work undertaken by the authors comprehensively document the approach necessary to undertake a project of this nature.

In summary, the requirements for the implementation of an effective risk management system include the following:

a.  Develop a risk exposure profile of the organization.

b.  Identify core business activities impacted by risk management.

c.   Analyze past losses and loss trends.

d.  Determine market factors influenced by risk exposure.

e. Integrate risk management with business strategy and introduce a program to make risk management part of the corporate culture.

f.   Address environmental issues as part of the cost of risk.

g.  Restructure the risk management and risk finance functions of the organization.

h. Implement a centralized loss information acquisition system and database and associated risk management information system.


7. CASE STUDY OF AN IMPLEMENTATION PROCESS

A major South African corporation which had previously self-insured all losses recently undertook the introduction of a comprehensive risk management program including the implementation of an integrated risk management information system addressing many of the aspects discussed in this paper. The information system implemented was the prototype of a more comprehensive system proposed for future development. The system was developed and implemented in late 1992 and has been successfully used since then to acquire comprehensive loss statistics and as an information base for introducing comprehensive risk management and risk financing practices throughout the organization.

The system is currently being used to process in excess of 10,000 loss incidents from five regions around the country using four operators. With the statistical base that has now been developed, the basis of risk funding between insured, self-insured and uninsured losses is being optimized and a comprehensive risk improvement program is being implemented. The system is also being used to monitor the progress of insurance claims submitted. It is estimated that a staff of about 12 would have been required to process the same information using conventional techniques without providing any of the management information that the computerized system makes available. Major enhancements to the system are envisaged based on experience to date with the objective of developing a commercial software system aimed at the corporate market.


8. CONCLUSION

A wide range of factors applicable to risk management with particular emphasis on the management of the physical factors contributing to risk have been discussed. The need to directly associate the financial implications of losses with the physical factors giving rise to risk is identified as is the need to record losses which are traditionally not accounted for. It is concluded that this can only be effectively accomplished using a comprehensive, integrated loss database and computerized risk management information system. Some of the benefits of this approach and conceptual considerations are addressed and brief case histories are presented.

It is concluded that the effective management of risk in organizations in a manner that will produce significant improvements in loss reduction will also give rise to significant improvements in operational efficiency and substantial overall profitability improvement. These benefits will only be achieved if an holistic approach to risk management and risk finance is adopted that takes account of hidden, as well as visible costs and is associated with a restructuring of the risk management and risk finance components into a single area of accountability. The application of leading edge information technology is a vital component of this solution but must be associated with practical and effective implementation within the organization.


FOOTNOTE

CRM Risk Control Consultants is a firm of specialist risk management consultants within the Price Forbes Group of Companies which specializes in providing a comprehensive risk management consulting service to clients. CRM Risk Control Consultants can be contacted on (011) 637-2148.

Differentiated Strategic Solutions (dS2) is a firm of independent business information system specialists concentrating on offering information systems consulting, software development services and strategic software products with particular emphasis on the fields of decision support and management information. They place particular emphasis on innovative solutions which enable clients to create and sustain competitive advantage and on the effective implementation of such solutions and have been involved with CRM in the development and implementation of the information system on which the case history is based. Through associates in The MaXus Group and other associated specialists they are able to provide a wide range of additional consulting and other services. Differentiated Strategic Solutions can be contacted on (011) 886-9863.

The contribution of our clients and associates without whom we would not have had the opportunity to evolve and develop these concepts is gratefully acknowledged.


REFERENCES

Robertson (1992(1)) Effective Implementation of Executive Information Systems. Paper presented at Executive Information Systems Conference, Johannesburg, March 1992.

Robertson (1992(2)) Enhancing Information System Effectiveness: The Human Element. Paper presented at Executive Information Systems Conference. Johannesburg, March 1992.

Robertson (1994(4)) A Practical Approach to Implementing Integrated Information Systems in Real Companies. Paper to be presented at SAICE IT Division Conference on Integrated Information Solutions in Engineering Practice, Johannesburg, October 1994.

Valsamakis, Vivian & du Toit (1992) The Theory and Principles of Risk Management. Butterworths.

22 to 23 June 1994

Download the CRM Risk Control: Designing and Implementing an Integrated Risk Management System -- Article in Adobe pdf format

018 Designing and Implementing an Integrated Risk Management System that Effectively Minimizes your Exposure -- CRM Risk Control Case Study -- by Dr James A Robertson PrEng from James Robertson


Download Designing and Implementing an Integrated Risk Management System that Effectively Minimizes your Exposure -- Slides in Adobe pdf format

Download Designing and Implementing an Integrated Risk Management System that Effectively Minimizes your Exposure -- Paper in Adobe pdf format


Section 8.3

Rennies Group General Ledger case study -- headlines

The headlines of the Rennies Group General Ledger case study are as follows:

1.  Group consolidation general ledger solution

2.  220 companies of great diversity from Travel to Foreign Exchange to Fishing Trawler Fleet to Trading to Sugar Terminal to Vehicle Rental, etc

3.  Established fundamental drivers across the entire Group

4.  Group wide view of high level financial performance

5.  Dramatic increase in management information

6.  Presentation with client – greatest recommendation


Information Architecture and Design of FIS

Rennies Group Limited Case Study

Financial Information Systems Conference

By Kerstin Speer CA(SA), Group Financial Manager, Rennies Group Limited and Dr James A Robertson PrEng


SYNOPSIS

The background to the introduction of a Group-wide financial reporting and management information system for Rennies Group Limited (RGL) is outlined in the context of current thinking on the application of Financial Information Systems (FIS). The status of the Rennies Reporting System (RRS) at the time the decision was taken to develop an information architecture and design is summarized.

The desired components of a three year FIS strategy are presented together with the FIS strategy already in place at RGL.

Considerations with regard to the implementation at RGL are given with particular reference to the fact that a clearly defined customer focused business strategy was already in place and that an EVATM programme was underway.

The procedure followed in undertaking the information architecture and design of the Rennies Group consolidation Master Chart of Accounts included extensive involvement of users and management, definition of a generic, structured business information classification scheme and building a framework to support future development. It is noted that provision is made for a future business model to be developed which will support full cascading of the chart of accounts down to the operational business unit level while maintaining the integrity of the consolidation process. Also revenue and cost driver classification was undertaken in a manner that was independent of individual business units and which will support restructuring, acquisitions, mergers and divestments in the final form of the business model.

A conceptual framework for inter-region, branch and subsidiary analysis has also been laid.

The manner in which RGL has integrated existing systems is outlined with particular reference to the upload of the financial intelligence of the software to assist with integration is described. The importance of the information architecture in achieving this objective is highlighted.

The benefits of implementing FIS are outlined and it is noted that certain flagship operations have leveraged the capabilities of the solution by moving their management reporting function onto the new system while it was still in pilot operation. These sites achieved considerable improvement in analysis and reporting capability with a resulting time saving that was used to free financial personnel up to undertake more effective analysis.

A summary of the benefits that RGL has obtained from FIS strategy is provided and it is noted that the current project has laid the foundations for a long term process of progressively improving management information delivery and decision support within the Group in a manner that has the potential to enable the Finance Function to add considerable value to the operating entities.

It is concluded that effective information architecture and design is vital to ensuring a return on investment in FIS and that, if this is correctly undertaken and implemented, it will enable the Finance Function to add considerable value to the organization at all levels.


1.  INTRODUCTION

The concept of Financial Information Systems is well established as a result of many conferences and other development. Robertson has addressed a number of aspects of this subject, most recently at the Financial Management Information Systems Conference, held in Midrand in September 1994 at which a paper entitled, Identifying Your Key Business Objectives to Develop a Coordinated FMIS Strategy that Meets Your Specific Needs was presented. As a result of the presentation to this conference, it was decided to introduce some of the concepts addressed in the presentation into the "Rennies Reporting System" (RRS), which was currently being planned.

RRS is a group-wide consolidation and reporting system using a commercial consolidation product, Hyperion. RRS objective is to consolidate information from the approximately 220 operations in the Rennies Group up to Group Head Office in Johannesburg in a manner that will support Group reporting requirements and support the overall business strategy of the Group. This paper presents some of the concepts applied in the project to date in the form of a case study.

As noted above, the solution was implemented using commercially available software. This was installed on a client-server database platform. The subject of this case study is therefore not the design or selection of a software and technology solution but the information architecture and design of the business solution implemented using the product selected. It is hoped that this paper will serve to draw readers attention away from technology and cause them to focus on the business design issues surrounding the use of Information Technology (I.T.) in general and FIS in particular.


2.  WHAT SHOULD FIS STRATEGY ENTAIL

Robertson, in the paper referred to above, recommends that a three year FMIS strategy should incorporate the following:

a. Determine broad business objectives.

b. Determine what financial information is required in order to give effect to these objectives

c. Determine what financially related business concepts should be introduced or enhanced in order to meet these objectives in support of improved management decision making.

d. Evaluate the fundamental changes to financial operating procedures and systems required to support the objectives including:

i.    First principles analysis of financial systems and coding systems.

ii.  First principles analysis of the business model incorporated into the financial systems to support unambiguous ownership.

iii.  Comprehensive review of up-stream and down-stream controls on the flow of information in the FIS.

iv. Evaluation of implementation considerations with regard to system acceptance.

e. Investigate use of multiple bases of accrual.

f. Develop overlay ledgers for different levels of adjustment, such as EVA.

g. Develop a culture of future focused management applying these concepts to create and sustain competitive advantage in a manner that truly adds value to the organization.

h. Consider the extension of the FIS to become part of a "Corporate Command Center"

This approach to FIS strategy is the vision of the Rennies Group and has the commitment of management. It also has the potential to truly differentiate the organization.


3.  RENNIES GROUP IMPLEMENTATION CONSIDERATIONS

In the case of Rennies Group Limited (RGL), the project was undertaken as an extension of an existing project which was already underway. In particular, RGL had already clearly defined its strategic objectives as a customer focused service organization and had appointed Stern Stewart and Company to implement a comprehensive Economic Value Added (EVATM) program. In addition, the technology platform and software for the RRS had already been selected and a project plan had been drawn up.

The implementation was therefore undertaken on a limited scale with emphasis on first principles analysis of the information classification schemes and coding of the Group Consolidation Ledger to support the great diversity of businesses in the Group. The group ranges from well-known operations such as Rennies Travel, Rent a Bakkie, Renfreight and XPS to less well known trading and freight management businesses such as Manica which operates throughout Southern and Central Africa.

Basic consideration was given to conceptualization of the business model and overlays for management accounting purposes but these will be designed in detail as part of a later phase of the project.

Implementation was undertaken by way of a multiple pilot site deployment in terms of the original project plan under the guidance of Group Information Services.

Accordingly, this paper concentrates on the information architecture and design of a Group Consolidation Chart of Accounts to serve the full diversity of companies within the group.


4.  INFORMATION ARCHITECTURE AND DESIGN OF THE GROUP REPORTING GENERAL LEDGER CHART OF ACCOUNTS

Design was undertaken by way of a series of workshops with senior financial and operational managers of the larger divisions and companies within RGL. During these workshops, the following was achieved:

a. Widespread consultation with senior end users.

b. Development of a clear understanding of the diversity of businesses within the Group with a particular emphasis on determining business unit independent definitions of Revenue Drivers and Cost Drivers in a manner that would enable a generally applicable chart of accounts to be developed which would accommodate any change in organizational structure, including acquisitions, mergers and divestments.

c. Design of a highly structured information classification scheme that supported full hierarchical analysis and drill down within the guidelines given by Robertson (19949 and others).

d.  A design that supported both disbursement and expense orientated operations.

e. A framework to support monthly, year-end, tax, management and EVA reporting requirements, amongst others.

f.  A clear understanding of the business model that should be implemented.

g. Conceptual definition of a framework against which inter-region, inter-branch and inter-subsidiary analysis could be implemented at a later stage. This also provided a conceptual framework for definition of a market sector input : output analysis at the financial level.

h. Definition of a solution that could be "cascaded" through the Group to individual operating companies and eventually to SBU level.

i.  Definition of a solution that would provide the foundation for business modelling and a broad based "Executive Information System" (EIS) at a later date in a manner that would enable Group Finance to add considerable value to individual operating companies in time.

The information architecture and design of the RRS Chart of Accounts was spread over a period of approximately two months with a high level of involvement from the Group Financial Manager, Project Manager, Consultant and other team members throughout this period. Approximately ten workshops of from two to eight hours duration were held with users and management of groups of subsidiaries and individual companies. Further project meetings took place throughout the period. The end result was a consolidation chart of accounts with approximately 700 posting level accounts suitable for implementation across the entire organization at a business unit level.


5.  HOW RENNIES GROUP LIMITED HAS INTEGRATED EXISTING SYSTEMS

Existing general ledger systems were integrated in the following way:

a. Existing general ledger charts of accounts were mapped onto the Hyperion consolidation chart of accounts in paper mapping exercises facilitated by the project team.

b. ASCII upload files were generated from the existing systems in a format that could be uploaded into the Hyperion software.

c. The functionality of Hyperion permitted a direct link between existing systems such as Accpac, Accountability and Millenium through account conversion and name conversion tables.

d. The upload used as building blocks groups of accounts classified into categories including:

i.   Income statement accounts (revenue, disbursement and expense).

ii.  Balance sheet accounts (intangible assets, assets, liabilities).

iii. Reporting accounts such as cash flow and budget.

iv. Balance and control accounts.

v. Non-financial, derived and other information for purposes such as tax, year-end, EVATM, etc.

e. A basic business entity model was implemented in order to provide systematic consolidation into Divisions and from Divisions to Group. This model reflects the organizational structure of the group.

f. Separate input and adjustment entities are defined for use in different stages in the process.

g. Input ledgers are maintained in the currency of origin and foreign currency translation takes place at the appropriate location in the organizational structure.

h. Reporting is performed using the reporting capabilities of the tool used together with dynamic linking to the Microsoft Excel Spreadsheet package.

The project team is currently busy with the deployment of the application to further sites and the extension of the application to more fully support all aspects identified.

Business modelling, market modelling, geographic analysis and the introduction of an EIS are scheduled to take place in the second half of the year.

Effective integration was made possible by the structured financial information classification contained in the Master Chart of Accounts referred to previously. This structure ensures that, while individual subsidiaries may apply different accounting treatments with regard to aspects such as disbursements, the Group consolidation figures are based on a uniform treatment which accommodates the diversity of business operations.


6. BENEFITS OF IMPLEMENTING FIS

While the RRS system will only run live from 1 July 1995, it is currently in use for budget purposes for the 1995/96 financial year. It is currently deployed at the Divisional Level as well as at 18 major operations.

Benefits that are anticipated from the RRS include a saving in the production of the Group Tax statements of approximately three weeks at year-end, a saving in producing the year-end pack of approximately two weeks together with a considerable reduction in reconciliation and manual reprocessing effort. A monthly saving of 3 days per month at Group Level in producing consolidated Group Financial Reports is anticipated.

It has been found that all operations have been able to map their existing general ledger accounts onto the consolidation chart of accounts successfully, although individual entities have experienced some difficulty where more detail has been requested than they are accustomed to providing.

More tangible benefits have been experienced at certain pilot sites where enthusiastic and proactive involvement by financial management and the executive of the companies concerned has resulted in the full potential of the system being realised. In one notable case, a subsidiary moved it's management reporting off their existing bureau based general ledger systems onto the new system while still in the pilot stage because of the greatly improved reporting capabilities of the new system.

In this case, the time saving resulting from improved ease and effectiveness of reporting has been beneficially utilized in undertaking more detailed analysis in support of management effectiveness. This is expected to give rise to better decision making with regard to branch viability and competitiveness and an increase in market share is projected as a result.

In another notable case, a one-to-one link between the existing general ledger system and RRS has created a powerful reporting tool which is exploited fully by this operation. Furthermore, by efficiently using the name structure capabilities of the tool, reporting of profit centres by region, product type and executive is simple and flexible and is empowering the user in preparing financial information.

In flagship cases such as the above sites, a major benefit to Group Finance has been an opportunity to be seen by subsidiaries to be adding value to the operations of the Group. This demonstrates the potential synergy of a forward thinking central Group Finance Department anticipating the decision support information needs of subsidiaries.


7. WHAT HAS RENNIES GROUP LIMITED GAINED FROM FIS?

The expected benefits of the RRS FIS and those experienced to date are set out in the preceding section.

In addition, Rennies Group has gained a platform on which a wide variety of value adding services can be delivered by Group Finance and financial management of individual operating companies. This business solution platform provides a basis on which:

a. Improved Group reporting can be built.

b. A corporate business model can be implemented.

c.  Group-wide EVATM analysis and reporting can take place.

d. Reporting of Key Performance Indicators (KPI's) including non-financial components can be undertaken.

e. Regional and market based analysis can be designed and implemented

f. Improved reporting effectiveness at the operational level and improved management decision support.

Significant further analysis and design of the business model and other components referred to above will be required before these can be implemented. Much of this is planned for the second half of 1995.


8. CONCLUSION

The background concepts and business environment surrounding the Rennies Reporting System have been outlined together with major considerations taken into account in the information architecture and design of the system. Particular emphasis is placed on the importance of effective information classification and the approach adopted in developing a Group-wide Master Chart of Accounts is set out in some detail.

Principal strategic considerations and factors to be taken into account in planning the FIS project have been summarized.

Certain initial benefits experienced by Rennies Group Limited, including dramatic improvement in financial management reporting capability of flagship sites are outlined. Other expected benefits are summarized. Opportunities to develop market focused analysis and reporting capabilities are identified as a particularly important component of future opportunities.

It is concluded that effective information architecture and design of an FIS can give rise to significant benefits and are vital if the Finance Function is to be seen as adding value to the organization.


ACKNOWLEDGMENTS

The support of the management of Rennies Group Limited and their permission to publish this paper is gratefully acknowledged as is the contribution of all members of the project team.

The contribution of dS2's clients, associates and staff, without whom it would not have been possible to evolve and develop these concepts is gratefully acknowledged.


FOOTNOTE

Rennies Group Limited is an investment and management company in a multi-business netork focusing on freight management, travel and other related services. The Group provides resource backing to autonomous operating companies operating in Southern Africa through ownership and internationally through alliances.

Rennies Group Limited is jointly controlled by two major South African corporations, namely Safmarine and Rennies Holdings Limited and Anglo American Industrial Corportion Limited.

The Rennies Group has operated in Southern Africa for 146 years and is a regional force in the transport services industry. Employing some 10,200 people, Rennies offers in excess of 30 different services through more than 350 locations in eight countries in Southern and Central Africa.

The Group's current strength and future strategy linges on three crucial factors:

- A single-minded focus on managing the movement of people & freight.

- The depth of its skills.

- The breadth of its network.


Differentiated Strategic Solutions (Pty) Ltd is a firm of independent business information system specialists, management consultants and software developers. They are able to provide the full range of professional services necessary to architect, design and implement financial information systems and to integrate existing systems including all aspects outlined in this paper.

Particular emphasis is placed on aspects of design and implementation necessary to improve business process and maximize information return on investment. Products and services include the information and systems architecture, design and implementation of financial information systems from a fundamental first principles basis, the conceptualization, specification, construction and implementation of integrated information systems, enterprise information systems (EIS), corporate command centres and other business information systems.

They also offer a range of services with regard to strategically focused financial management information determination and linking financial planning to business strategic and macroeconomics in terms of the capability of the balance sheet and economy to sustain strategic objectives. System audits, development of IT strategies and business system feasibility analysis are other services.

Together with associates in The MaXus Group and other associated specialists they are able to provide a wide range of additional consulting and other services in support of the concepts outlined in this paper extending to comprehensive Business Process Optimization services applying techniques developed through an international network of expertise. dS2 can be contacted on Johannesburg 886-9863 or fax 787-0132.


REFERENCES

Robertson, J A (1994) Identifying Your Key Business Objectives to Develop a Coordinated FMIS Strategy that Meets Your Specific Needs Presented at Financial Management Information Systems Conference, Midrand, September 1994.

30 to 31 March 1995

Download the Information Architecture and Design of FIS for Rennies Group -- Article in Adobe pdf format

026 Information Architecture and Design of FIS -- Rennies Group Limited Case Study -- by Dr James A Robertson PrEng from James Robertson


Download Information Architecture and Design of FIS -- Rennies Group Limited Case Study -- Slides in Adobe pdf format

Download Information Architecture and Design of FIS -- Rennies Group Limited Case Study -- Original Paper in Adobe pdf format


Section 8.4

African Sales Company case study -- headlines


The headlines of the ASCO ERP Implementation case study are as follows:

1. James Robertson as Project Leader and Strategic Advisor on turnaround of stalled project

2.  Comprehensive taxonomies

3.  "A strategic resource"

4.  Hard lessons learned about level of rigour required

5.  Unexpected benefits relating to data precision

6.  High level of ownership by the client

7.  Paper co-authored by CEO of Client – greatest recommendation


Doing things differently and better

ASCO Case Study 2

BPM Summit 2013

1.   Overview of the business – marketing and brand management

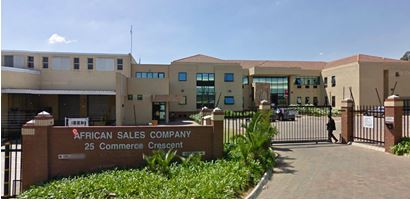
African Sales Company is a moderate sized family owned business that imports and distributes fragrances, perfumes and related products.  They also provide a brand management service to their suppliers and distribute fine fragrances and luxury cosmetic brands like Dior, Givenchy, Gucci, Dolce and Gabbana, Paco Rabanne, Carolina Herrera, Prada, Calvin Klein, Hugo Boss and others to retail vendors like Edgars, Foschini, Truworths, Stuttafords, Woolworths, Dis-Chem and others.  ASCO does this with prescribed service levels aiming at 98% fill rates and three day delivery times from receipt of EDI orders to goods being available at retail points.


In order to understand the business it is vital to understand the close juxtaposition of brand management and distribution.


2.   The challenge – overview of the situation before the investment

The challenge that gave rise to this project was an old customized software suite that had grown with the business on a tight budget.  The accounting with regard to brand related costs was handled by more than 20,000 accounts in the General Ledger.  Other aspects of Brand Management were manual.  Tracking costs and reporting on many brands to multiple Suppliers was a major challenge.


3.   The opportunity – implementing a new ERP and Warehouse System taking a strategic view

A point was reached where a new system was required and an integrated suite of ERP and Warehouse Management System was purchased.  Initially a comprehensive workflow (process) analysis was undertaken but the project stalled.  The project was then restarted with a strong strategic and precision configuration focus with tight project management and successfully brought to completion – the process maps were left on the shelf.

During the project it was identified that areas of the business that would benefit from a new approach – particularly relating to brand management expense allocation and a custom solution was conceptualized, designed, built and implemented in order to maximize the effectiveness of brand management.


4.   The solution – highly structured Product Class, integration with Projects Module, custom software

The total strategic solution comprised:

a. The Brand Hierarchy – a highly structured Product Classification of all products linking from Suppliers down to individual Brand Lines – this created a high value logical information platform that underpins every aspect of brand and business management;

b. A selection of fundamental highly structured custom product attributes that have opened up diverse strategic intelligence and analytical opportunities;

c. Intelligent Product Master maintenance that draws on the intelligence in the Brand Hierarchy and attribute lists to ensure that default values are cascaded down the hierarchy so that new product take-on generates high quality intelligent data that impacts every aspect of system operation and management information;

d. Rule based automated creation of Marketing projects linked directly to the brand hierarchy coupled to a highly structured cost taxonomy provided a comprehensive framework for Brand Management information.  This custom functionality, based on knowledge of the codes, opens the door for convenient and powerful marketing planning, cost analysis and reporting;

e. All of these components taken together have created a holistic and integrated intelligent information platform that has resulted in the business now having a much stronger analytical focus, capability and culture.


5.   The outcome – greatly improved brand management and other capabilities supporting profitable growth and competitiveness

Taken together this capability improved expense allocation accuracy, allowed detailed ROI analyses, increased competitiveness through informed allocation of resources, facilitated growth and stimulated profitability in significant measure through the investment in strategic precision configuration and associated custom development.  This capability assisted ASCO to grow significantly, take on new accounts and reach a point where a new distribution centre became a business necessity such that a new warehouse is currently in the design phase.

Associated with this capability has been the development of a highly analytical culture which has positioned ASCO as an industry leader in the management of information and therefore Brand Management in its specialized category.

It should be noted that as a consequence of the development of these capabilities there have been further changes to practices and ways of working (processes) which have flowed organically from the original analysis and decision making capabilities.


Download the ASCO Case Study -- Creating Competitive Advantage -- Priebatsch and Robertson -- Presentation in Power Point pptx format

Download the ASCO Case Study -- Creating Competitive Advantage -- Priebatsch and Robertson -- Slides in Adobe pdf format

Download the Doing things differently and better -- ASCO Case Study 2 -- Article in Adobe pdf format


Section 9 -- Other references & Section 10 -- Conclusion

Section 9.1

Why your IT project may be riskier than you think

Harvard Business Review -- headlines


The headlines of the article are as follows:

1.  Mainstream, leading edge publication – this is serious and real 

2.  Examples of ERP projects gone horribly wrong

3.  Major international client organizations

4.  Mainstream, world leader ERP

5.  Mainstream, world leader implementer

6.  Massive cost and time over-runs

7.  Massive business damage

8.  Forced resignation

9.  There is something horribly wrong with the ERP industry – the approaches in this manual are a major component of the missing link


Section 9.2

19 out of 20 ERP implementations do NOT deliver what was promised

Financial Mail -- headlines


The headlines of the article are as follows:

1.  Financial Mail -- mainstream Business Journal – credible source

2.  Survey of executives

3.  "19 out of 20 ERP Implementations do NOT deliver what was promised"

4.  Shocking statistic

5.  There is a major problem in the ERP industry that this manual seeks to address


Section 9.3

Most organizations are NOT making better decisions

than they did five years ago

Gartner -- headlines


The headlines of the article are as follows:

1.  Gartner -- mainstream research organization – credible source

2.  Survey of over 1,300 Chief Information Officers

3.  "Most organizations are NOT making better decisions than they did five years ago"

4.  Serious indictment of the Business Intelligence and ERP industries – something is seriously wrong

5.  The material in this manual explains why and what is required in order to fix it


Section 10

Conclusion

This manual is still very much a work in progress but I hope that it has provided you with sufficient insight to see that there is no alternative to Strategic Engineered Precision Taxonomies and Precision configuration and to see that James A Robertson and Associates are the most appropriate business partners to assist your organization in developing sustainable precision taxonomy solutions.

I look forward to being of assistance.


James Robertson

James@JamesARobertson.com


Random Selection of Articles by Dr James Robertson

SNw 053 Strategic Essence: The Missing Link: Part 5 -- Discovering Strategic Essence

Overview of a simple and reliable process that you can apply to determine the strategic essence of your organization
Std 016 Procurement: 08 Bid Adjudication Score Sheet

The Bid Adjudication Score Sheet is a set of weighted factors designed to focus the adjudication team on those requirements that are CRITICAL to the success of the project measured in terms of Business Outcome.  Factors are determined in close consultation with the client Chief Executive and Executive Team
SNw 051 Strategically Enriching your BIS: Part 3 -- Steps in applying these recommendations

Steps in applying these recommendations with regard to precision configuration in terms of a method of working geared to quickly and efficiently developing high quality data content that captures the essence of the organization and creates a platform to help the organization thrive
Sem 05 IBIS – The Strategic View of Business Information

A three hour Executive Briefing that outlines the most important aspects of what I advocate with regard to Integrated Business Information Systems, including ERP

Dr James A Robertson PrEng

Business Systems NOT delivering?

Call the Business Systems Specialist

Dr. James Robinson

Dr James A Robertson -- has been involved in the effective application of Business Information Systems, including but NOT limited to ERP, since 1987 and in the profitable and effective use of computers in Business since 1981.

Drawing on a diversity of experience, including formal military training in Quick Attack techniques at the Regimental Commander level, Dr Robertson has developed highly effective methods of investigating any sub-optimal Business Information Systems situation -- be it an established system or a stalled project or any other source of Executive frustration -- quickly and concisely diagnosing the root cause of the problem and prescribing concise practical actions that Business Executives can effectively act on see the Pulse Measurement page and also the Sample Reports page for redacted real reports.

He has also developed highly effective methods of strategically enriching systems to unlock the full potential of existing investments, see the Precision Configuration page and couples this to architecting small pieces of clever software that harness the full potential of your investment, see the Software page.

If you are having problems with your systems, your project or your IT Department, call The Business Systems Specialist
James@James-A-Robertson-and-Associates.com

Business System Failure is RIFE -- we offer insight into why this happens AND WHAT is required to prevent it.

Failure is at epidemic levels with massive damage done to client companies -- if you are NOT aware of the extent of the problem please visit the About Failure page for a catalog of major failures running to billions of Pounds and Dollars.

All evidence indicates that the established players do NOT know how to deliver stable, reliable high value solutions that WORK.

There HAS to be a better way!

This website provides information relating to that way with a large collection of white papers, presentations, standards documents, etc that you can use to start bringing the situation under control

We also offer high level advisory services with regard to the application of the principles advocated on this website

We offer an ENGINEERING APPROACH to addressing these issues

Click here to read more about the Engineering Approach

By Engineering I mean the formal, structured, highly disciplined, highly systematic, highly practical approach that consistently delivers results in ALL areas of human endeavor where formally trained and certified engineers are the ONLY practitioners permitted to operate -- think large buildings, factories, motor vehicles, aircraft -- highly complex systems that work at a level that we take it for granted that they WILL work and where failure is all but unthinkable and, when it happens, attracts immediate public attention and rigorous investigation directed at ensuring that such failures are prevented in the future -- in fact, everything that the management consulting industry that implements complex software systems is NOT

This approach is discussed further on the Engineering Approach page.

Search Articles


Random Selection of Articles by Dr James Robertson

Book -- The Critical Factors for Information Technology Investment Success

In 2003 I undertook an in-depth analysis of all the information and experience that I had gathered with regard to the factors giving rise to Business Information System failure including ERP and general IT and classified this information into a number of categories including "The Factors Causing Failure" and "The Critical Factors for Success" based on this I developed a two day Course "The Critical Factors for Information Technology Investment Success" which is still offered today.

Based on this I wrote the book of the same name, which is available in electronic form here for download:

Subscribe to our Newsletter

Click here to send us an email subscribing to our free newsletter -- all articles posted by James Robertson will be emailed to you

Connect with James Robertson on LinkedIn

James has a very detailed profile on LinkedIn should you require further information about him.

You can also connect with him on LinkedIn at http://www.linkedin.com/in/DrJamesARobertsonERPDoctor

James has an open networking profile -- click on "Connect" and use email address James@LinkedIn-at-JARA.com.

Contact Us

You can contact us on

Email: James@James-A-Robertson-and-Associates.com

LinkedIn at http://www.linkedin.com/in/drjamesarobertsonerpdoctor

Facebook at https://www.facebook.com/james.a.robertson.393

Mobile: +44 (0) 776-862-2875

Landline: +44 (0) 207-059-0007

Fax: +44 (0) 844 774 4580

Articles by James A Robertson and Associates

There is a large body of white papers, articles and other content produced by Dr James Robertson available on this website

Please click here to visit the detailed listing of articles

ArticleTagCloud for Articles Published by James A Robertson and Associates

7 steps to FIX your ERP      80:20 regarding software replacement      aborted projects      abstract      abstractness      accounting      actionable      adjudication      Advantage Data Transformer      advisory      agreement      all possible classifications      all reports      all software elements required      all spreadsheets      all tasks required to execute the project      Alpha Omega      analysis of data      analytics      animation      answers to the questions we have NOT yet thought to ask      Armscor      arrogant ignorance      art of strategic business information system project leadership      ASCO      attendance register      attorney      audit      audit cost reduction      bankrupt organizations      basis for achieving alignment      basis of payment      basis of pricing      better way      bid adjudication      bid adjudication score sheet      bid compliance      bid compliance checklist      bill of materials      bill of services      BIS      BIS failure      BIS success      boots in the mud      BPM      BPM dangerous      BPM distracting      BPM ineffective      brainstorming      break it until it does NOT break anymore      break it until it will NOT break any more      budget      budgeting      business engagement      business executives      business improvement      business information system      business information system failure      business information system success      business information system taxonomies      business information systems      business information systems procurement      business information systems projects      business integration      business intelligence      business intelligence models      business knowledge and experience      business participation      business process      business process mapping      business requirements focused      business requirements specification      business simulation laboratory      business systems      business systems laboratory      business understanding      by the book      care      case studies      case study      CEO      CEO -- project leader communication      CEO as custodian      CEO definite views      certificates      challenges      challenging presentations      change facilitation      change for strategic reasons      chart of accounts      classification schemes      clever software      client changing scope      client compact      clinical codes      coaching      Cobol      COBOL CAN be retained      Cobol still viable      code schemes      coding conventions and standards      cognitive span      collapse      communication      competitive advantage      competitive advantage through precision configuration      competitiveness      compiler      complexity      compliance      compliance checklist      comprehensive testing      Compuware      conference speaking      conferences      confidentiality      configuration      consultant NOT delivering what required      contract      contract certificates      contract law      contracting      contractors      corporate planning      cost      cost-quality-time      CPT 4      CPT4      critical factors      critical factors for IT investment success      critical factors for success      critical factors for technology success      critical human foundation      critical issues      critical issues analysis      critical requirements      CRM Risk Control      cubic business model      custom development      custom software      customer focused      data      data content      data engineering      data entities      data warehouse      DB2      definitions      design against failure      design and development      design for success      determination of strategic essence      determining strategy      diagnostic code      diamonds in the dust      differentiated      differentiation      diffusion of innovations      discovery      dislike of failure      dispute resolution      do NOT change systems because of alleged software redundancy      do things competitors could NOT do      document pack      Dr James A Robertson      Dr James A Robertson PrEng      dramatic benefits      dramatically improved strategic management information      driver of success      Dunning-Kruger effect      ease of use      economic collapse      economics      effective communication      effectiveness      efficiencies      efficiency      efficient filing of emails      eliminate light bidders      email      engineer against failure      engineered data      engineering      engineering approach      engineering approach to strategy      engineering failure      engineering laboratory      engineering services      engineering solution design      engineering techniques      enhance differentiators      enhance the differentiators      enhancing the value of your present investment      ensuring project success      enterprise resource planning      ERP      ERP configuration      ERP failure      ERP procurement      ERP success      ERP taxonomies      ERP value      essence IS different      essence of business      essence of the business and how it thrives      ethics      examples      exceptionally bad code design      executive briefing      executive briefings      executive custody      executive decision support      executive engagement      executive forum      executive frustration      expose hidden agendas      facilitation      factors causing failure      factors causing IT investment failure      factors causing technology failure      factors to manage for success      failure      failure to address soft issues      fashion      file table of contents      Financial Information System      financial information systems      financial management      fixing your ERP      focus for projects      folder design      foundation for delivery      full training      functional entities      future      Gantt Chart      gap analysis      general ledger      George Paton      go-live      go-live certificate      governance      governance = care      governance failure      group consolidation      Group Consolidation Chart of Accounts      growth      gut feel factors      hand holding      harshest judge of governance      hate failure      head count reduction      health management software      hierarchies      high level requirements      high road      high value      high value implementations      high value solutions      high value systems implementation      highly effective chart of accounts      holistic view of solution      how do you achieve executive custody      how the organization differentiates itself      how to      how to do it      huge opportunity      human foundation      hype      Hyperion      IBIS      ICD 10      ICD10      importance of executive custody      improved management information      in-box rules      incremental enhancement of existing systems      ineffectiveness      inefficiency      information required from third party suppliers      information technology      information technology failure      Information Technology Strategy      information technology success      Informix      in-house courses      innovative software solutions      innovator      inside head of CEO      insightful      instructions      intangible      integrated business information system      integrated view of business      integrity      intelligent data      interactive training material      interview      invitation to bid      isolated CEO = explosion      IT      IT and strategy      IT Audit      IT failure      IT governance      IT lies      IT management      IT mythology      IT non-performance      IT people who lie      IT personnel socialization      IT procurement      IT projects that fail      IT strategy      IT systems      IT systems procurement      IT the harshest judge of governance      James Robertson      Jof Nelson      key performance indicators      Kirsten Speer      knowledge management      laboratory      lack of an engineering approach      lack of precision configuration      lack of strategic alignment      lawyer      leadership      legal agreement      legislation      lies      list of required software      listen carefully      litigation      logical entities      loss information      low road      loyalty      MacDonald      maintain code schemes      maintenance      maintenance management      Malcolm McDonald      management      management information      managing contractors      manual      marketing hype      master data      master data classifications      master test data      mature facilitation      mature facilitator      measurable      measures of alignment      mentoring      Microsoft Outlook      misrepresentation      missing link      mistique      morals      Munich      mystique      mythology      new future state      New South Africa      no drill down      non-disclosure      NOT classic project management      obsolete is a fashion statement      obsolete software      old software IS viable      once software works it always works      on-line seminars      opportunities      opportunity to turn the economy around      organizing Microsoft Outlook      orientation of IT staff      own business experience      passion to enable clients to thrive      people are part of the system      personality matrix      planning      platform for a tough contract      precisio      precision      precision configuration      precision configuration advisory      precision configuration leadership      precision data      precision taxonomies      Predictive Index      preparatory steps      prescribed table of contents      presentation technique      presentations      preventing failure      preventing falure      preventing project failure      pricing      principles      problem statement      procedure code      process      processor ignorant of language      procurement      procurement timeline      professional speaker      Professional Speakers Association of Southern Africa      profitability      programming languages are for the programmer      project facilitation      project leader      project leader -- CEO communication      project leadership      project management      project management IT project management      projects      prove it works      PSASA      psychology      psychometrics      public conferences      public presentations      public speaking      Pulse Measurement      quality      REAL issues in Business Information Systems      REAL value      recognizing failure      redaction      reduced audit costs      reduced head count      reference documents      Reg Barry      regulatory body      relationship Almighty      relationship orientated      remediation of existing systems      Rennies Group      reports      reports not reliable      request for proposal      requirements specification      results orientated      RFP      right things      rigorous process      rigorous strategic planning      risk management      Robert Priebatsch      robust business information systems procurement      robust business systems procurement      robust contracts      robust procurement      robust solutions      SAICE      SAP ABAP is similar to COBOL      scheduling procurement      scientific professional      score sheet      screen design      seminars      SEPT      service orientated      Service Orientated Architecture      simple techniques to enhance business information systems value      simulation      sloppy configuration      SOA      socialization      software      software assets      software design      software does NOT wear out      software is instructions for the bricklayer      software schedule      software specification      software specification standards      solution experience      solution knowledge      South Africa      South African Institution of Civil Engineering      speaking      Spirit Led      standards      strategic      strategic advisory      strategic alignment      strategic analysis      strategic analysis and design      strategic business improvement      strategic custom development      strategic definition      strategic discovery      strategic driver      strategic driving force      strategic engineered precision configuration      strategic engineered precision taxonomies      strategic essence      strategic financial information      strategic gap analysis      strategic governance      strategic information      strategic management      strategic management information      strategic plan      strategic planning      strategic project leader      strategic snapshots      strategic software      strategic solution architect advisory      strategic solution architect leadership      strategic solution architecture      strategically designed chart of accounts      strategy      strategy defined      strategy focused planning      Strategy Snapshot Toolset      StratGap      StratSnap      strengthen differentiators      structured analysis      structured chart of accounts      substantial management information      succeed by engineering against failure      success      successful deployment      survive      system knowledge and experience      table of contents      tailored presentations      take notes      taxonomies      taxonomy      taxonomy software      technology      technology failure      technology issues      technology management      tender document pack      tender pack      tender pack table of contents      test data      testing      The Critical Factors for Information Technology Investment Success      the Critical Factors for Success      the essence of the business      the essence of the business and how it thrives      the essence of the organization and how it thrives      the factors causing failure      the first hour      The REAL Issues in Business Information System success      things right      third party suppliers      third world countries      thrive      time      tipping point      tough certificates      tough contract management      tough contracts      tough procurement      tough terms      training      training material      treatment code      understanding of data      understanding the engineering approach      Uniface      unlocking value      use different languages for new components      V3 Consulting Engineers      validation data      value      versus process      video      webinar      webinars      weighted factors      what is executive custody      what is strategy      what is the essence of this organization and how does it thrive      what to do      where is IT going      why executive custody is required      why the organization exists and how it thrives      why your business information system is NOT delivering and HOW to FIX it      why your ERP is NOT delivering and how to fix it      workflow      writer     

Table of Contents

Home

About Dr James A Robertson PrEng -- The Business Systems Doctor -- and Other Topics

Catalogue of Major Business Information System Failures

About the Engineering Approach

James Robertson's Value Add

Attributes of a HIGH VALUE solution

Recognizing Business System Failure

The Critical Human Foundation

Old Software IS Viable

From South Africa

Competencies of Dr James A Robertson PrEng

About Professor Malcolm McDonald

Table of Contents

About my relationship with the Almighty Creator, Yah the Eternally Self-Existing

Comments relating to the Business Systems Industry and other topics

Testimonials and other positive material regarding James Robertson

Reference Articles

List of Articles

Article Catalogue

Achieving High Value Business Information System outcomes

Executive Custody -- What is it and HOW do you get it?

The REAL Issues in Integrated Business Information System Success

Part 1: Introduction

Part 2 -- Mythology and Lack of Executive Custody

Part 3 – Strategic Alignment and Precision Configuration

Why your ERP is NOT delivering and HOW to FIX it

IT Project Management

Pulse Measurement

CEO Anthony Lee Comments on his experience of the Pulse Measurement

No Charge Guarantee on the Pulse Measurement Service

Examples of Pulse Measurement Outcomes

Critical questions regarding the Pulse Measurement™

The Pulse Measurement Workflow

The Critical Factors for Business System (ERP+) Investment Success in the Pulse Measurement

Indicative Pulse Measurement Durations

What is a JAR&A Pulse Measurement?

Survival of the fittest – why it makes sense to measure the pulse of your business

Examples of Pulse Measurement Outcomes over 24 years

Sample Pulse Measurement Reports

Strategy

Strategic Essence: The Missing Link in Business Information Systems

Strategic Essence: Overview

Strategic Essence: Part 1 -- Strategy Defined

Strategic Essence: Part 2 -- Differentiation

Strategic Essence: Part 3 -- The Essence IS Different

Strategic Essence: Part 4 -- The Essence should be the Point of Departure

Strategic Essence: Part 5 -- Discovering Strategic Essence

Strategy -- the Essence of the Business: What is it and how do you develop actionable strategic plans?

Simple Steps to Increase the Strategic Value of your ERP Investment

Free Strategic Snapshot Toolset and Manual

A strategy focused planning system beyond traditional budgeting

Tough IT and ERP Procurement and Contracting that Works

Robust Business Systems Procurement

Part 1 -- Introduction

Part 2 -- Bill of Services, Laboratory, Go-live Certificate, etc

Part 3 -- Executive Engagement, Bid Compliance, Adjudication and other matters

Procurement Documents

Guidance and Advisory Services

The Art of Project Leadership

Why Regular Communication with the CEO is Vital

The Business Simulation Laboratory

Precision Configuration and Strategic Business Information Architecture

Precision Configuration based on Strategic Engineered Precision Taxonomies

The JAR&A Cubic Business Model

Highly Structured Strategic Chart of Accounts -- a Vital Element of your Corporate Information Arsenal

The Product Catalogue -- an Essential Element of any Precision Configuration

Attributes -- answers to the questions you have NOT yet thought to ask

Case Studies of Notably Successful Projects with high value Precision Configuration

092 Doing things differently and better -- ASCO Case Study 2-- BPM Summit 2013

088 Strategic ERP Invesment -- ASCO Case Study -- Service Management Conference and Exhibition Africa

026 Information Architecture and Design of FIS for Rennies Group -- Financial Information Systems Conf

018 CRM Risk Control: Designing and Implementing an Integrated Risk Mgmt Sys -- Integrated Risk Mgmt Conf

011 V3 Consulting Eng: Benefits of MIS to Professional Practice -- SAICE 15th Ann Conf on Computers in Civil Eng

Strategically Enriching your Business Information Systems

Part 1 -- Introduction

Part 2 -- Principles of Data Engineering

Part 3 -- Steps in applying these recommendations

Simple Steps to increase the strategic information value yield from your Business Systems Investment

The Full JAR&A Taxonomy Manual

Part 1: Introduction, Problem Statement, Definitions and Examples

Part 2: Why Use JAR&A, Required Knowledge and Experience, Cubic Business Model and Chart of Accounts and Taxonomy Software

Part 3: How to do it, Case Studies and White Papers and other References

Example General Ledger Manual

Business Process -- Irrelevant, Distracting and Dangerous

The RIGHT Approach

Custom Strategic Software Design and Oversight of Construction

Standards for Custom Software Specification

What IS Software?

IT Effectiveness

Organizing Outlook

Critical Factors for I.T. Success

A Moral and Ethical Dilemma -- Systems that Fail

Case Studies examining Business Information System failures

The BBC Digital Media Initiative Debacle

The Bridgestone -- IBM Conflict

Speaking and Training

Showcase of Conference Presentations

Most Viewed Presentations

Briefings and Seminars

Why your ERP/BIS is NOT delivering and HOW to FIX it

ERP and IT Procurement that Delivers Results

The Critical Factors for IT and ERP Investment Success

Other Seminars

Conferences and Public Presentations

Conferences 80 to 99 -- 2009 to Present

Conferences 60 to 79 -- 2005 to 2009

Conferences 40 to 59 -- 1996 to 2005

Conferences 20 to 39 -- 1994 to 1996

Conferences 01 to 19 -- 1989 to 1994

On-Line Seminars (Webinars)

Webinar on Preparing and Presenting Webinars

Contacting James A Robertson and Associates Limited